Target Screen |
|---|
|

Step 1. Configure Inquiry Criteria
In the i-AUD Designer, create inquiry controls to define the data filtering criteria.
1.1 Create Controls
- From the top menu area, click UI Bot > Calendar, Label to generate the controls.
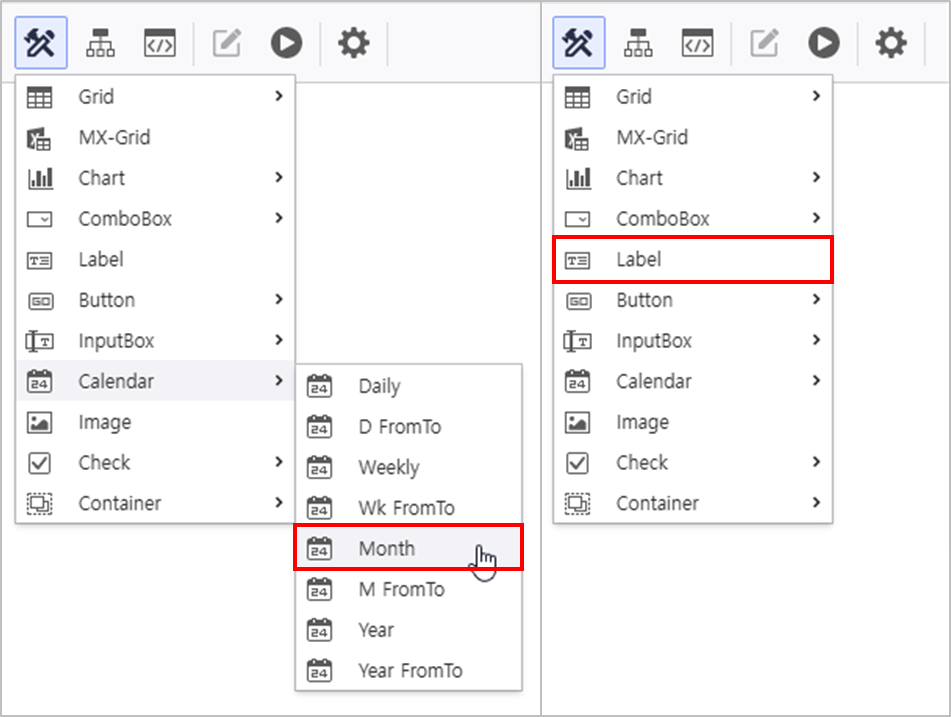
1.2 Set Control Properties
- In the property editor on the right, configure the Calendar attributes as follows:
- Name : VS_YM
- InitDate : Now() or DATE(0,0,0)

Calendar Property Setup Guide
To refer to the guide regarding Calendar property settings, move to the Link.
Additionally, configure the attributes for the Label control:
Name Text Label Year-Month 
Step 2. Connect Chart and OlapGrid
Create and link an OlapGrid and a Chart to represent sales performance by product.
2.1 OlapGrid Setup
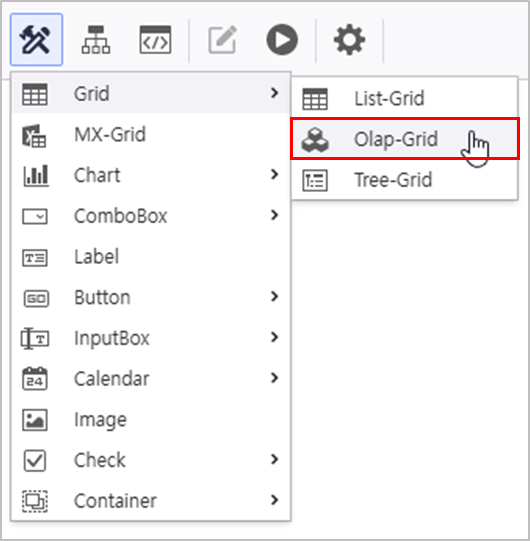
- Create OlapGrid
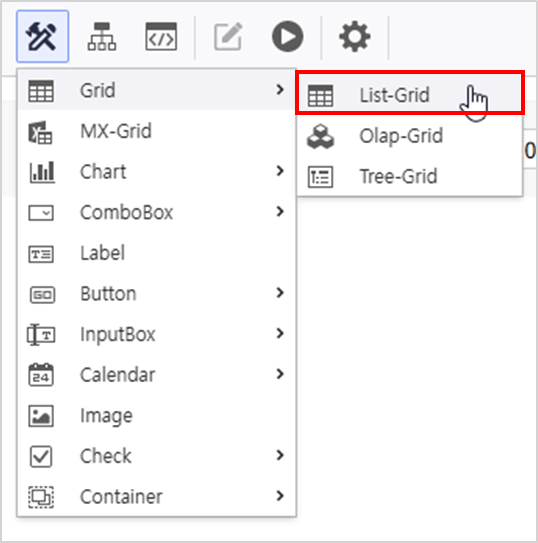
- Navigate to UI Bot > Grid > Olap-Grid.
Use the "Sales Analysis" META file to link the data source and enable AutoRefresh.

Link Data Source
Right-click OlapGrid > Data Source > i-META > Select META file.
- Sales Analysis Location : PPDM > Samples > 3. i-META > "Sales Analysis"
Enable AutoRefresh
Activate AutoRefresh in the properties pane on the right.

Query Item Query Condition Variable - Column : [Customer Grade]
- Data : [Revenue Amount]
[YearMonth] :VS_YM 
Right-click to open the Design menu, and change the following design properties:
Field Setting Other Settings - Change [Measures] position :
Column > Row
- Enable Auto Selection Area
- Range : Right 5, Down 1
- Disable Paging
- Activate Auto Selection Area

- Deactivate Activate Paging

- Change [Measures] position :
2.2 Chart Setup
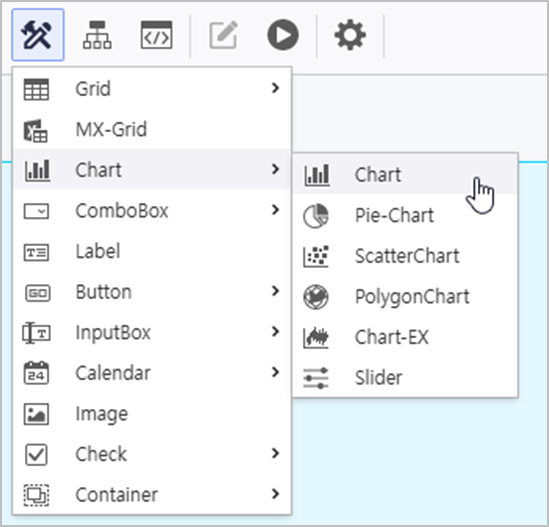
- Create Chart Control
- Navigate to UI Bot > Chart, and select Chart
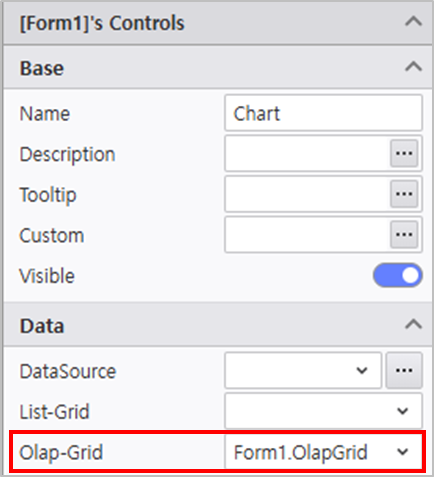
- In the property menu on the right, set the Olap-Grid target of the Chart.
- Olap-Grid : Form1.OlapGrid
Click the Design menu to change the following:
Basic Series Axis Legend - DataLabel : Value
- [Revenue Amount] > Others > DataLabel Align : BottomCenter
- Y1 Axis : Disable Visible
- X Axis > Design : Main Gridlines width 0
- Position : Top, Right
- Direction : Horizontal
- Verify the report is functioning correctly.

Step 3. ListGrid Setup
Configure a ListGrid to represent the detailed sales status.
- Navigate to UI Bot > Grid and select List-Grid.
- Set ListGrid Properties:
- Name : DG_DETAIL
- AutoRefresh : Active

Use the Sales Analysis META file to link the data source and enable AutoRefresh.
Query Items Query Conditions Variable [Customer Grade, Product Category, Product Subcategory, Quantity, Unit Cost, Unit Sales Price, Revenue Amount]
[YearMonth]
:VS_YM [Customer Grade] @:VS_LEVEL 
Variable Setup Guide
To check the guide regarding AUD Platform variables, click here.
- VS_YM :
Variable used to inquire based on the date value of the Calendar control.
- VS_LEVEL :
Variable to inquire ListGrid values based on [Customer Tier] data.
Utilized in Step 5. Script Editor
- VS_YM :
Click the Design menu to change the following:
Option > Common Option > Group - Show header > Row : Disable
- Group : [Customer Grade, Product Category, Product Subcategory]
- Position of subtotal : Top
- Position of grand total : Top
- Verify the report is functioning correctly.

Step 4. Use Process Bot
Configure modules for Chart design effects and report refreshing.
4.1 Configure Chart Gradient Effect Module
- Click the Process Bot icon from the top icons.

- Double-click Report in the Object tab to place it.

- Load the module to set the Chart gradient effect, link it with the OnDocumentLoadComplete event of the Report, and click the 4th icon for parameter settings.
- Module Name : "Set chart gradient color effect"

- Set each parameter as follows and click the Save button:
- List of chart control : Chart
- Enter the series value used in the chart : [Revenue Amount]
- Start color for gradient : #4BD0FD
- End color for gradient : #D5BAFE

4.2 Configure Inquiry Button Refresh Module
- Select and place Button from Process Bot > Object tab.

- Select the system module Refresh from the Activities tab, link it with the OnClick event of the Button, and set the target parameters..
- List of controls targeted for data retrieval : OlapGrid, DG_DETAIL

Step 5. Use Script Editor
5.1 Write Variable Initialization Script
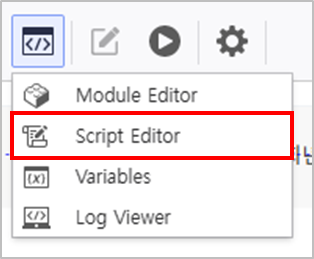
- Click Edit Group > Script Editor in the top menu.
- Search for the API and double-click it to use.
- API to Use : OnDocumentLoadComplete

Write the script for variable initialization.

5.2 Write DataGrid Refresh Script on Chart Click
- Search for the API and double-click.

Write the script for the event occurring upon Chart click.

Verify the report is functioning correctly.
