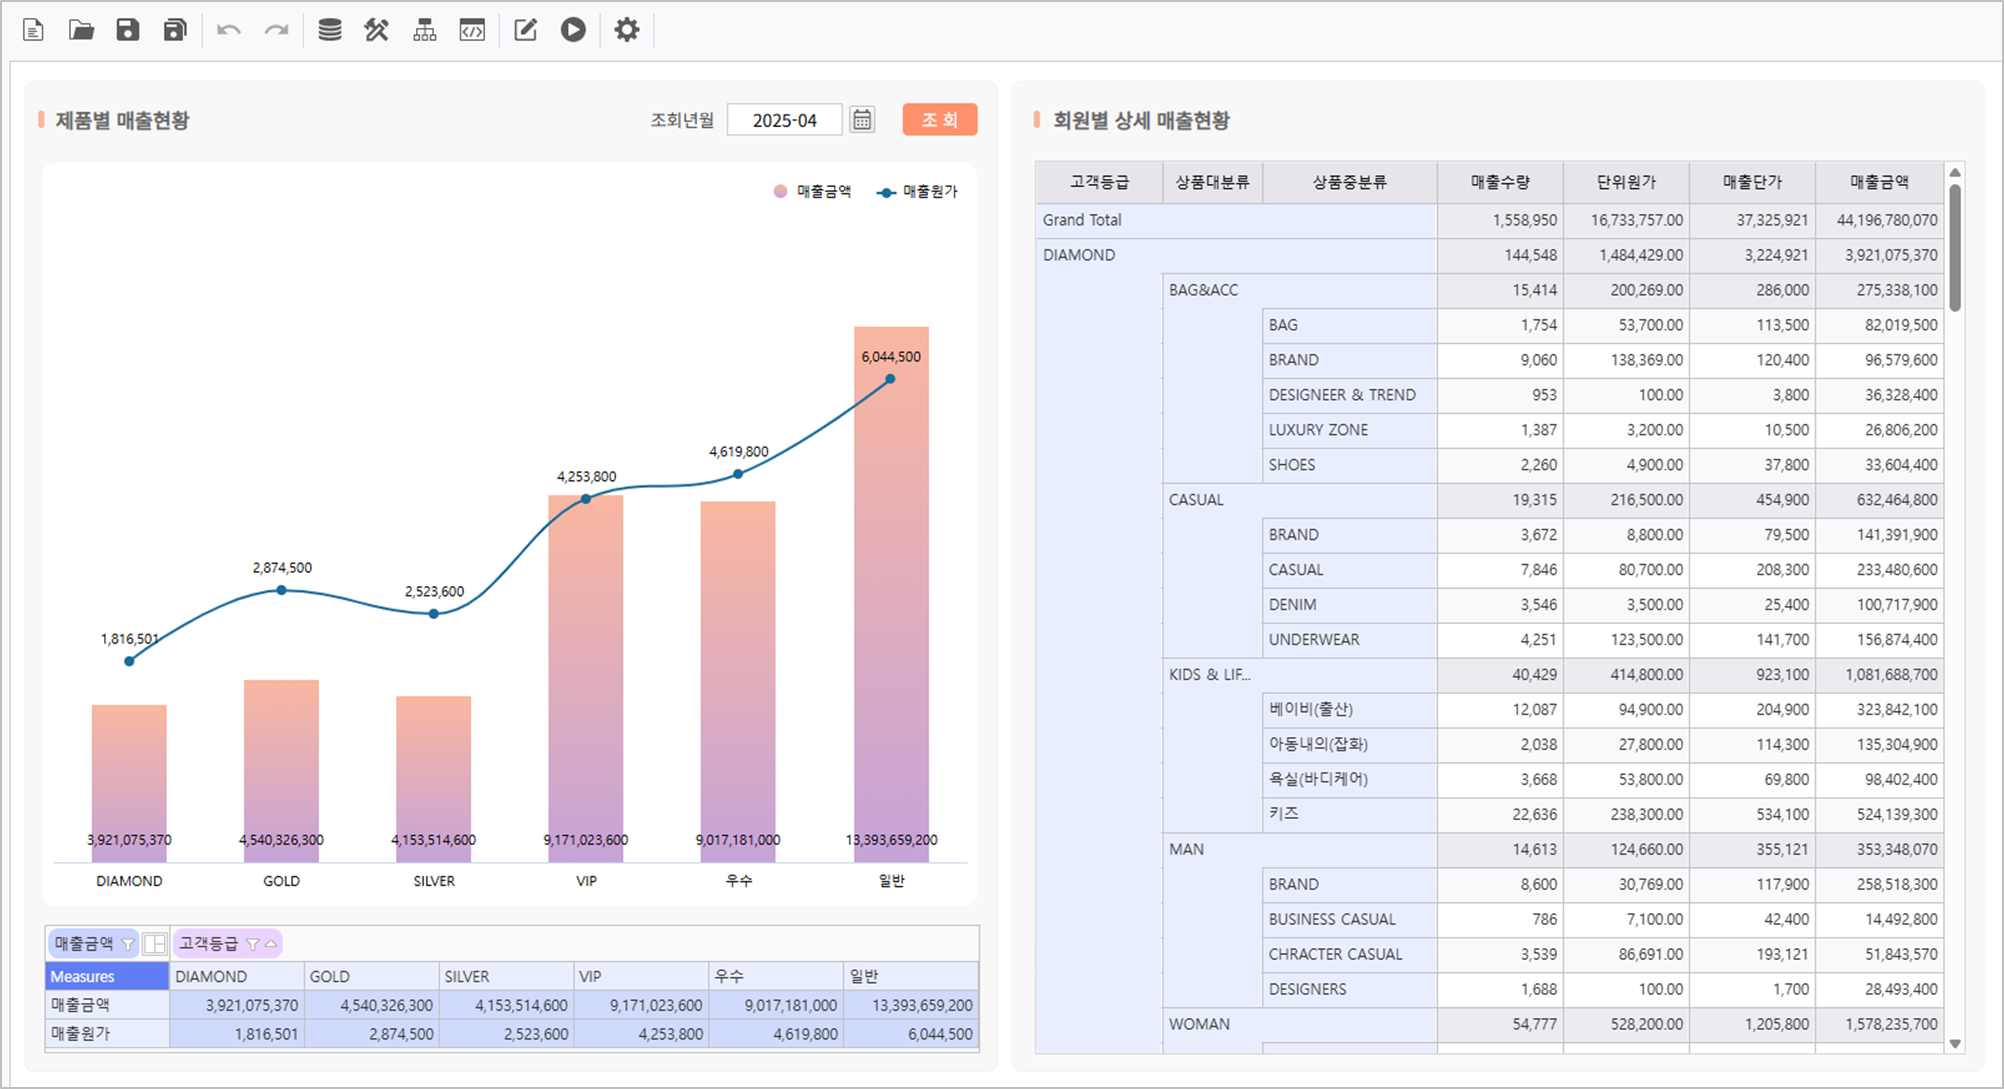
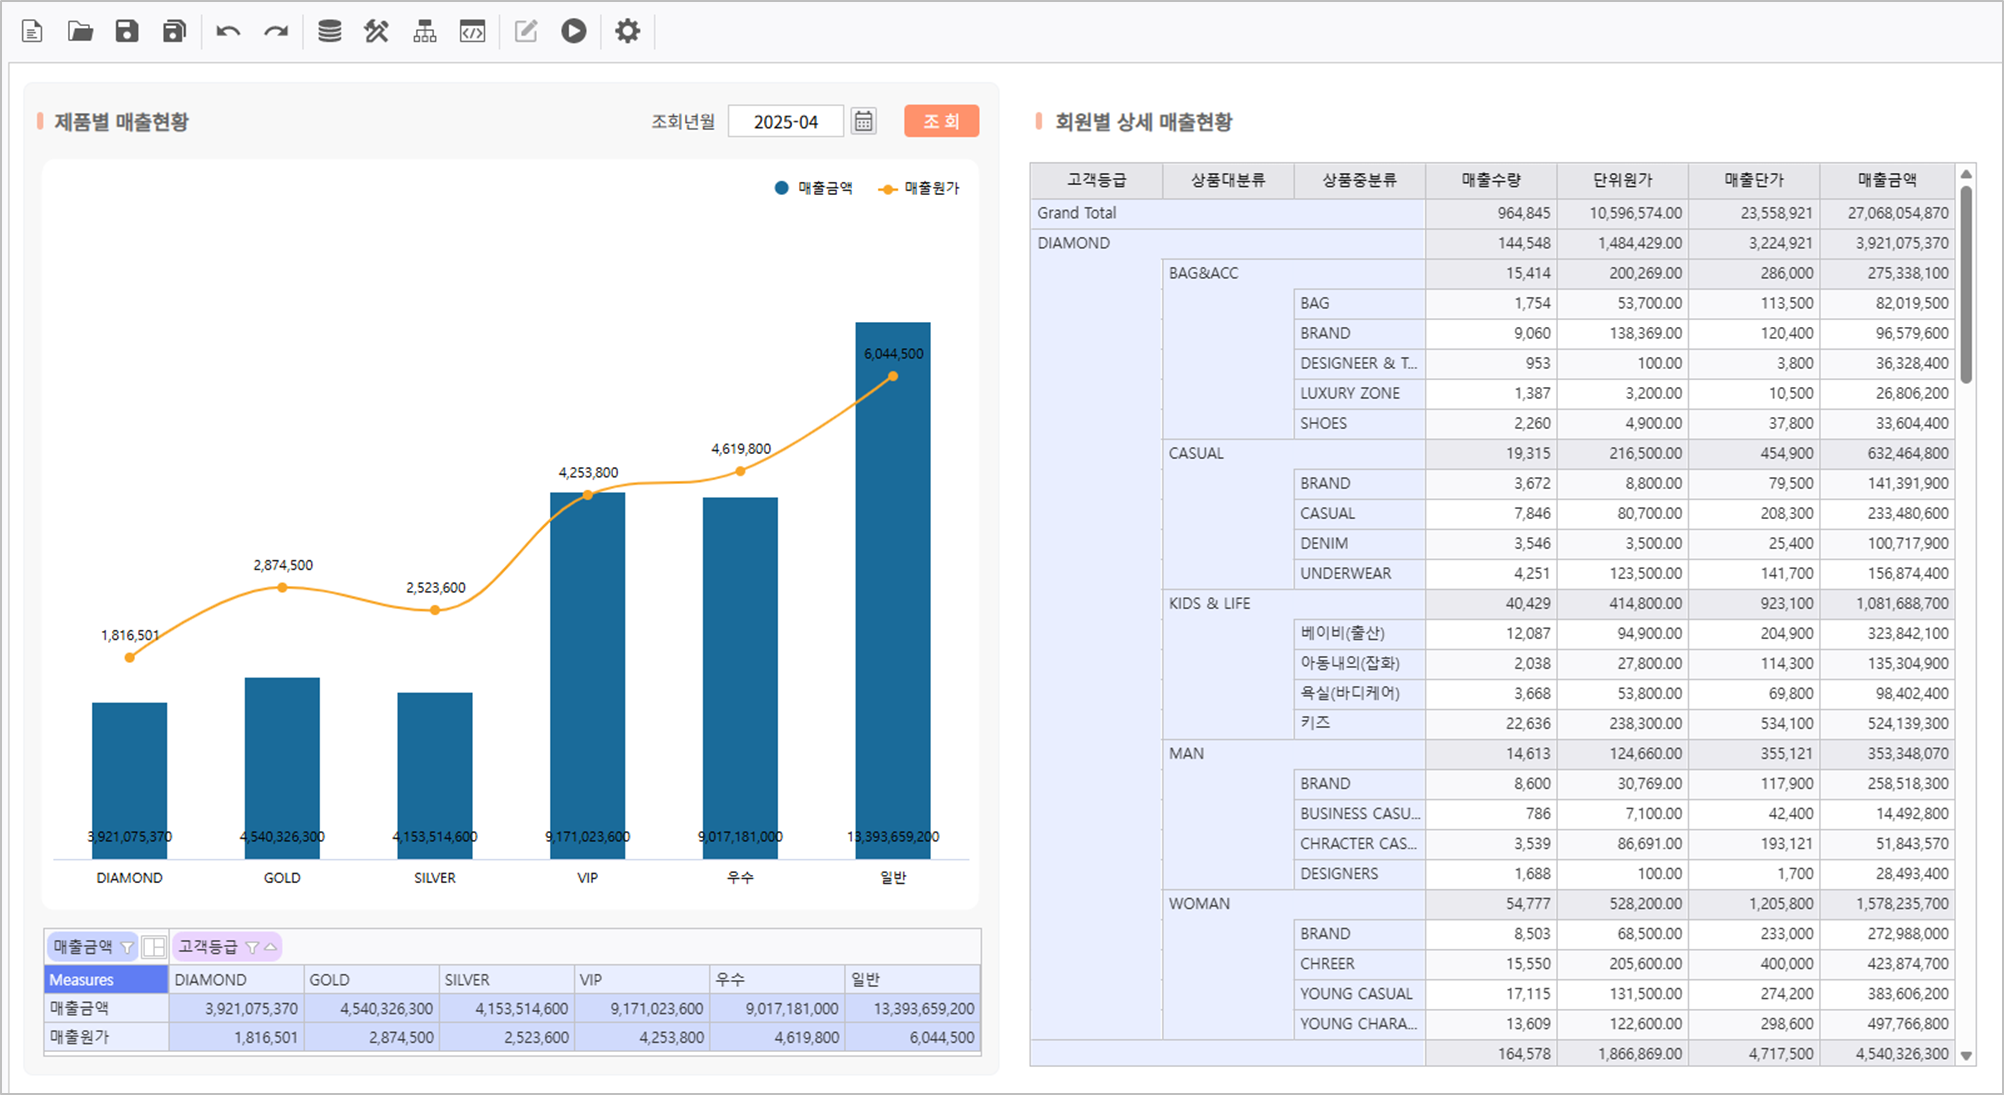
Target Screen |
|---|
|

Step 1. Set Query Condition
In i-AUD Designer, create a query condition Control and set query condition for data.
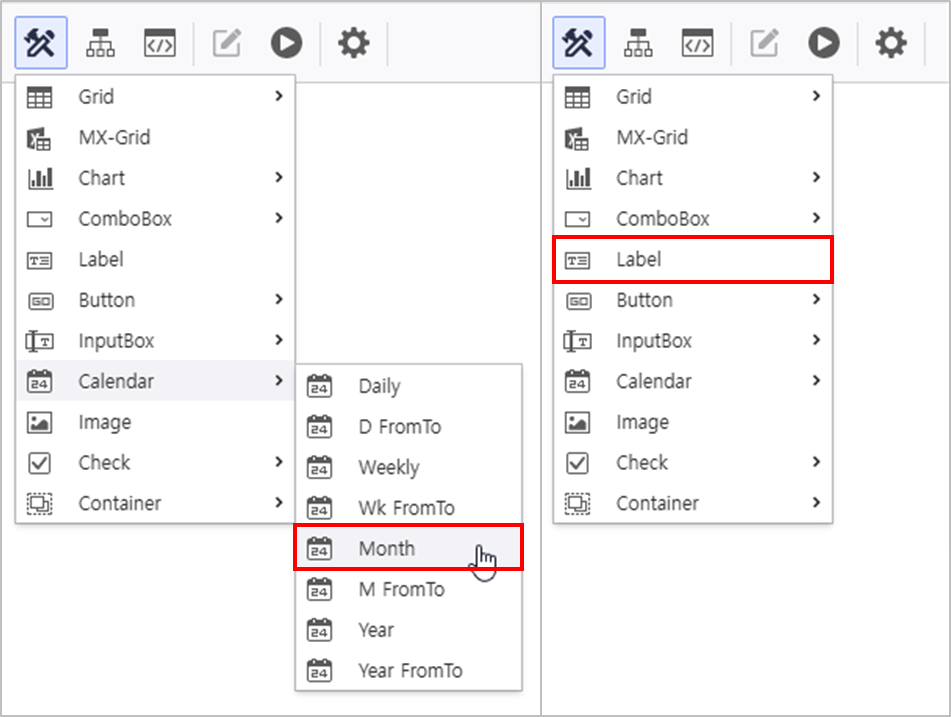
1.1 Create Control
- At the top menu, click UI Bot > Calendar, Label to create a label Control.
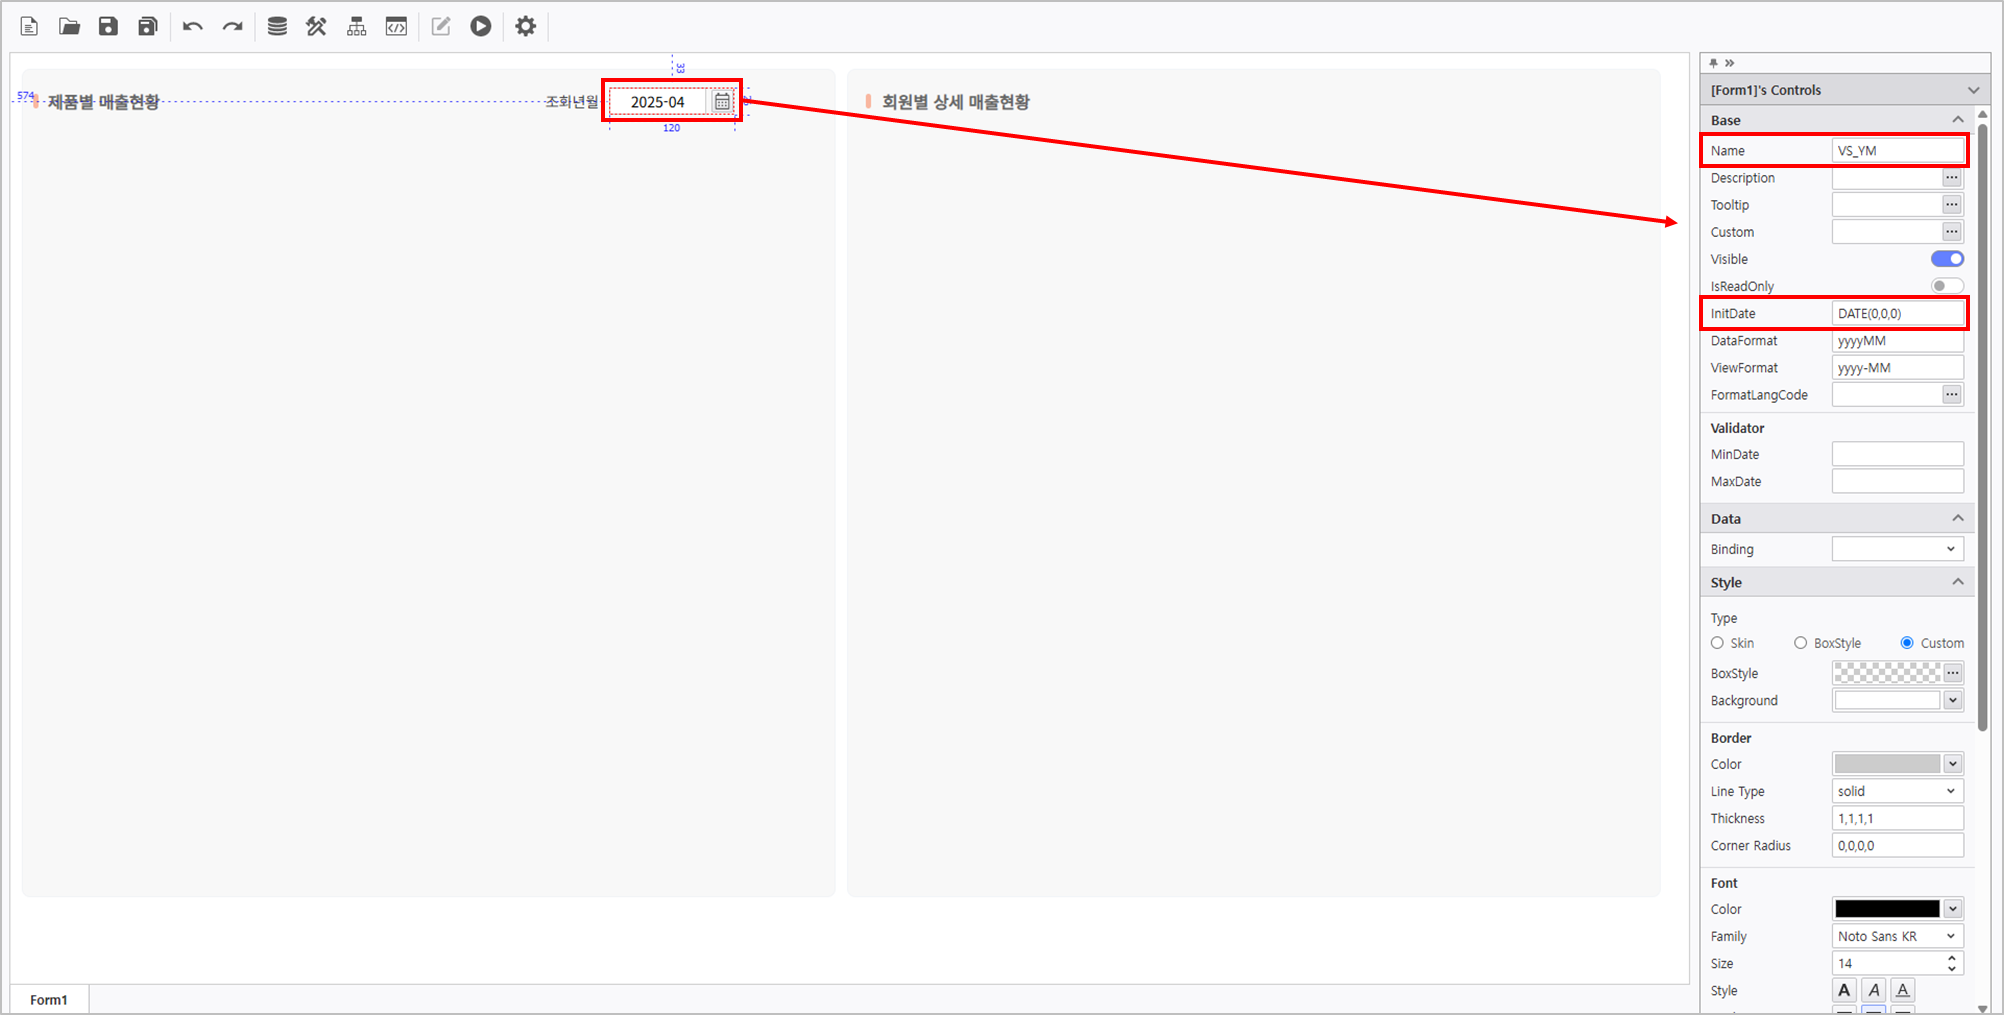
1.2 Set Properties of Each Control
- In the Properties Modification panel on the right, set the properties of the Calendar Control as below.
- Name : VS_YM
- InitDate : Now() or DATE(0,0,0)
Calendar Property Configuration Guide
For detailed information about Calendar Property Configuration, please refer to the Link.
Set the property of the Label Control.
Name Text Label Reporting Period 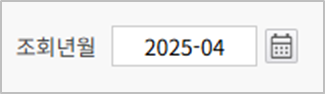
1.3 Create a Query Button Control
- At the top menu, go to UI Bot > Button and create a Button Control.
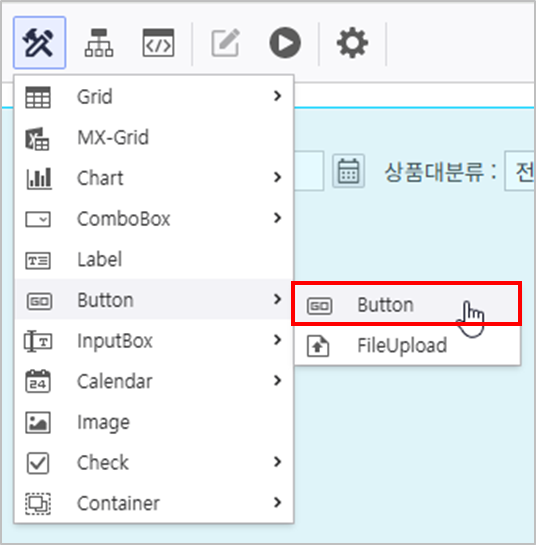
- In the Properties Modification panel on the right, set the properties as the following.
- Name : Button
- Text : Search
- Background : #ff926c
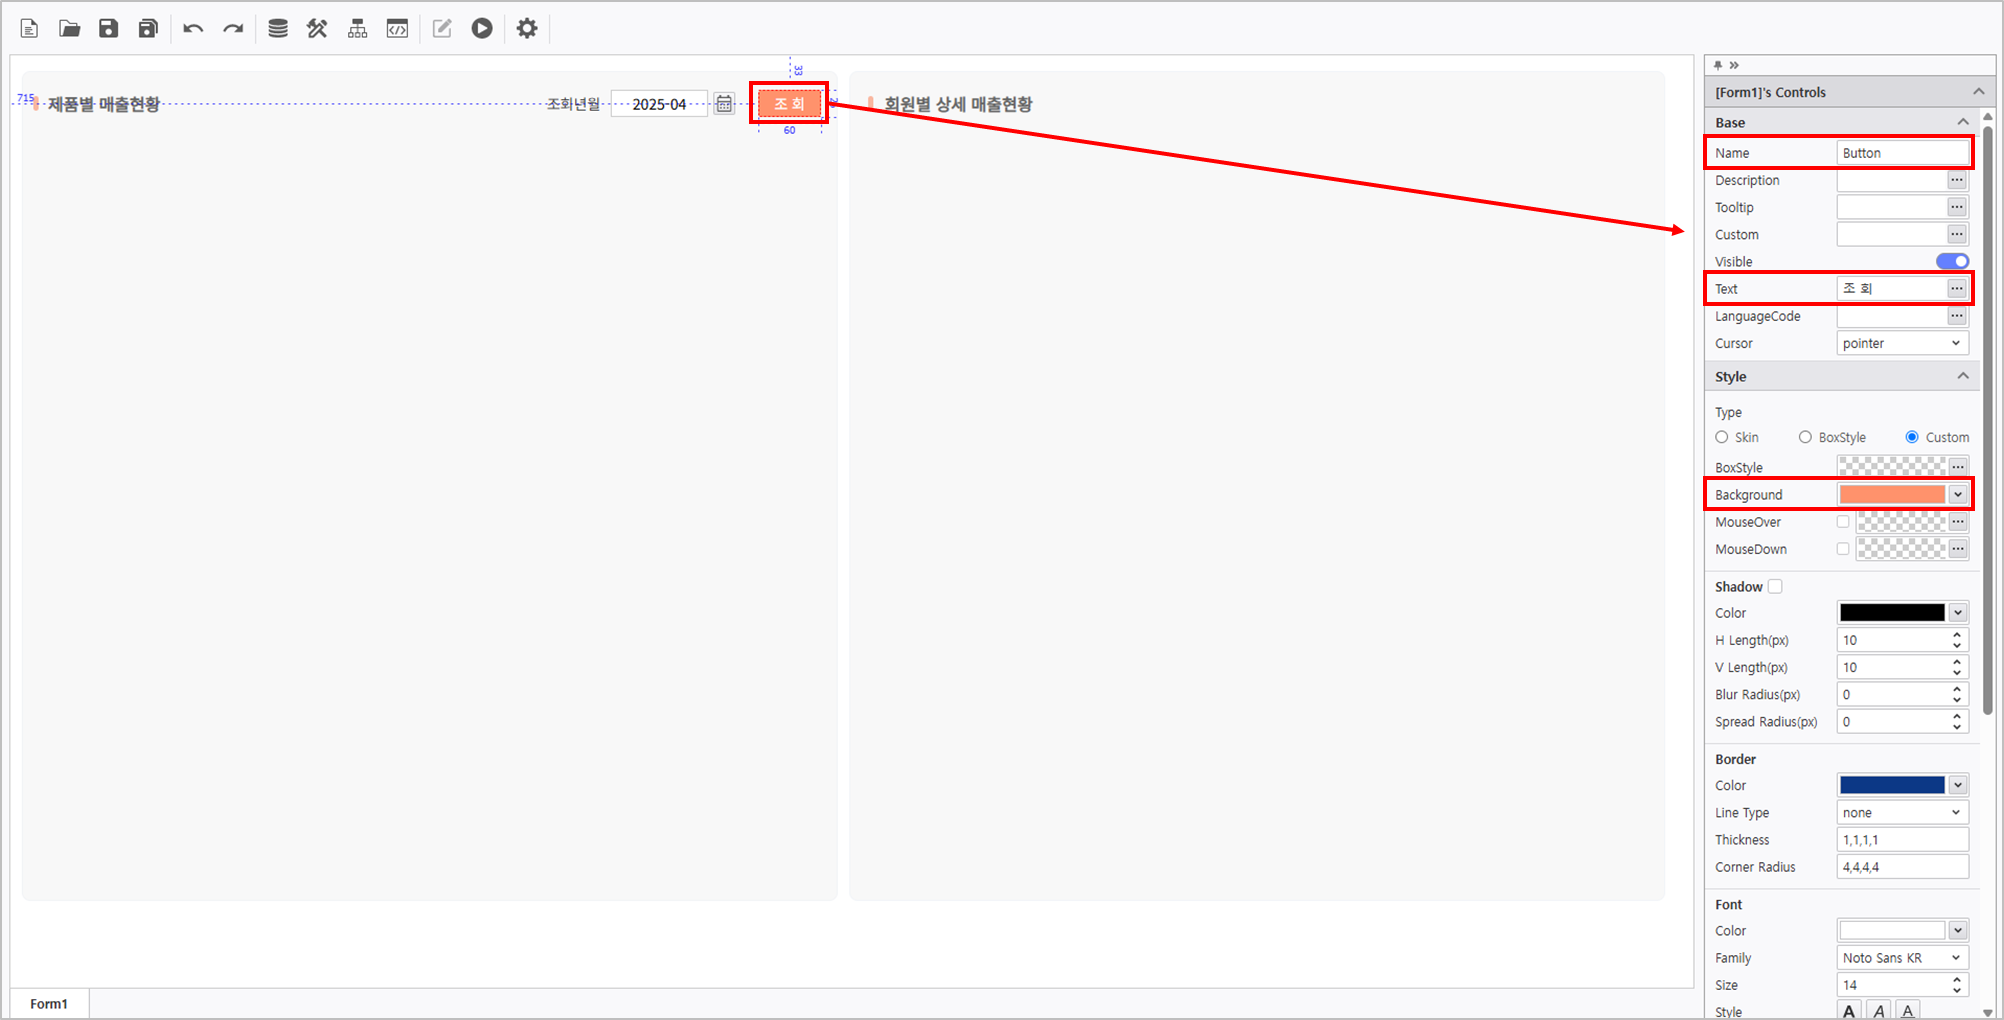
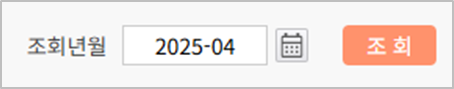
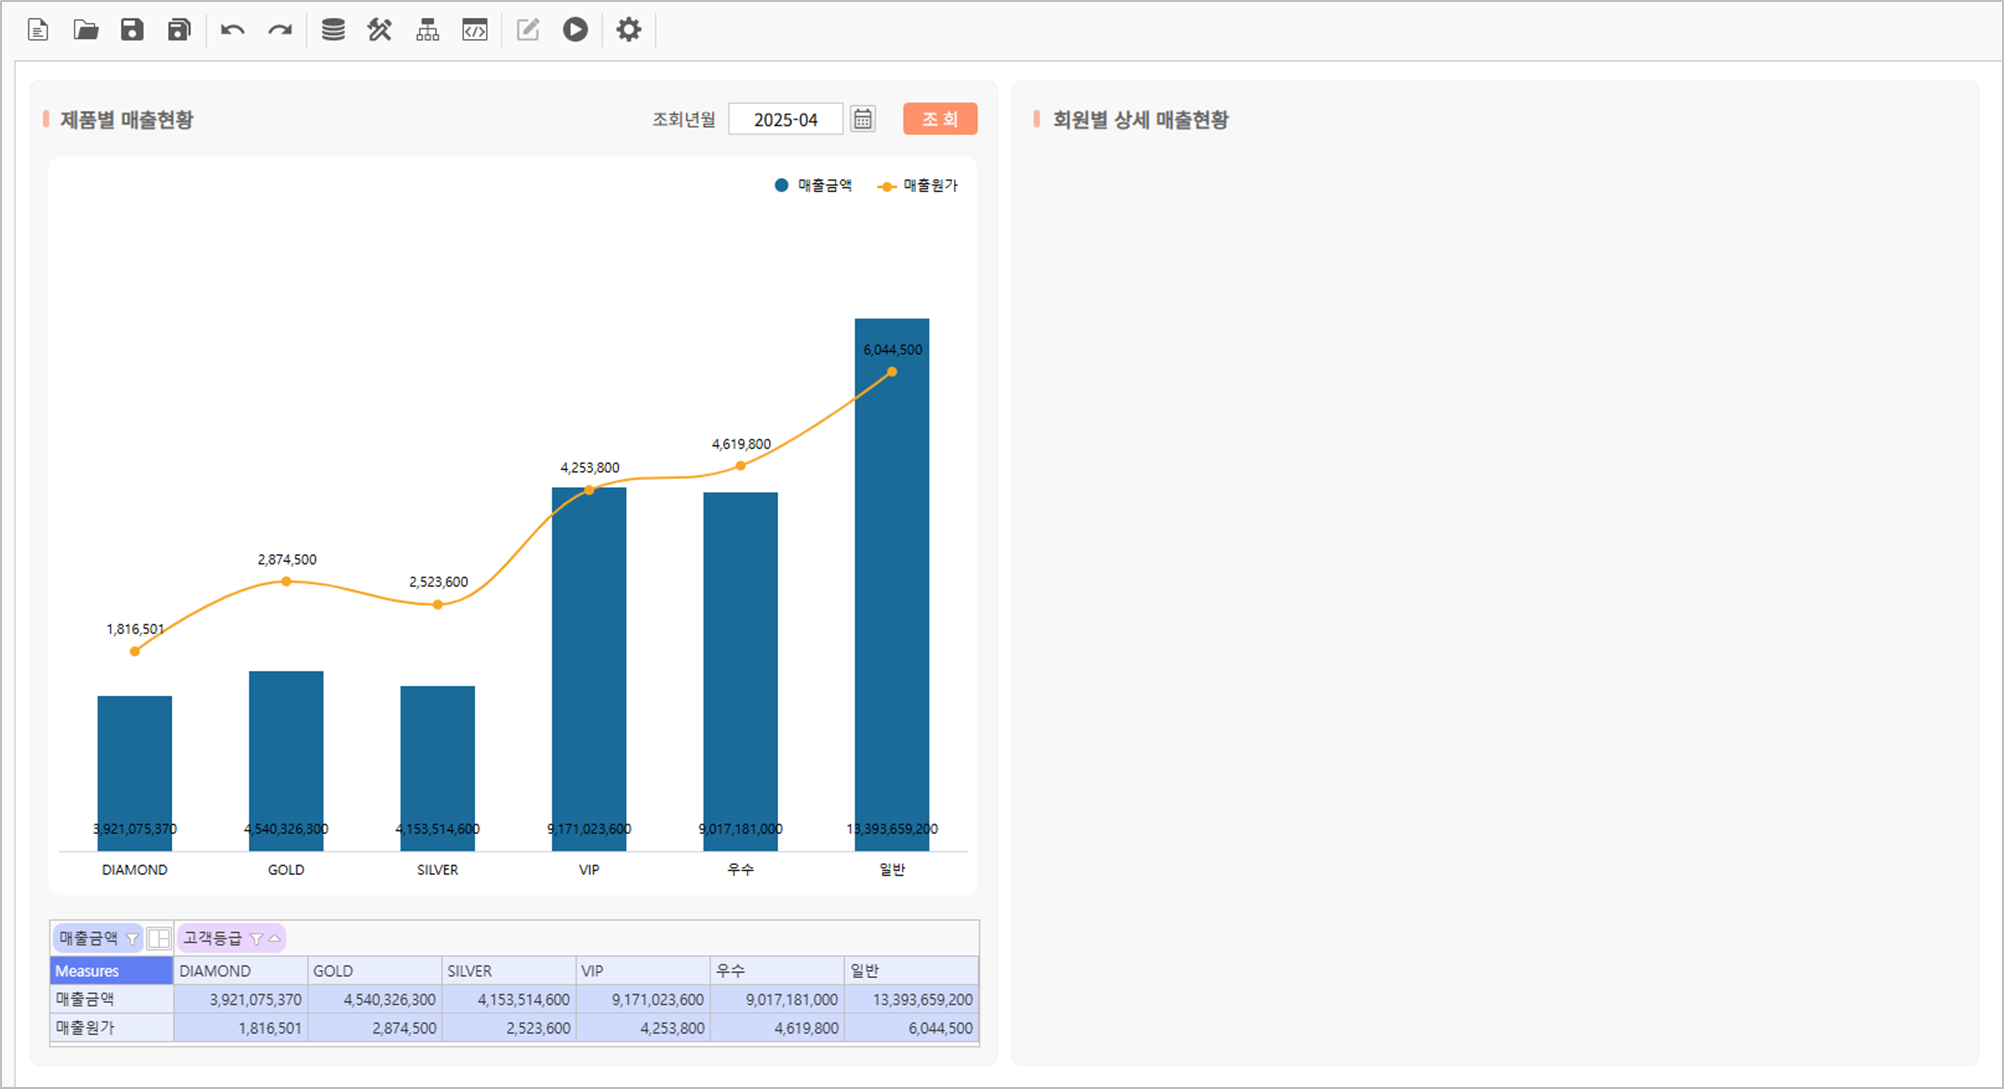
- Verify that the Query Condition Control is placed as below image.
Step 2. Connect Chart to OlapGrid
Create and connect a OlapGrid and a Chart to display Sales Performance by Product.
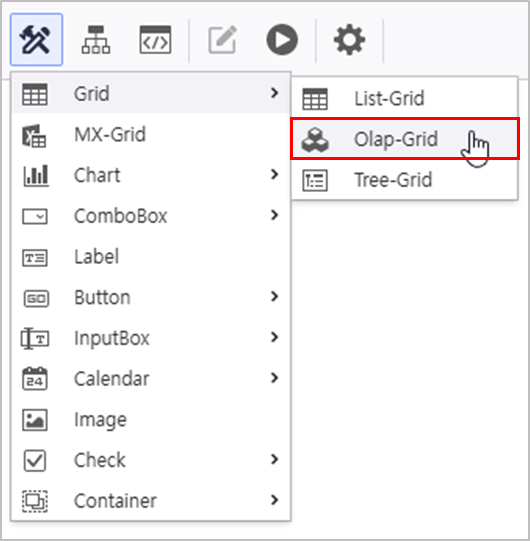
2.1 Set OlapGrid
- Create a OlapGrid
- Go to UI Bot > Grid > "Olap-Grid"
Connect datasource using Sales Analysis META, and activate AutoRefresh.
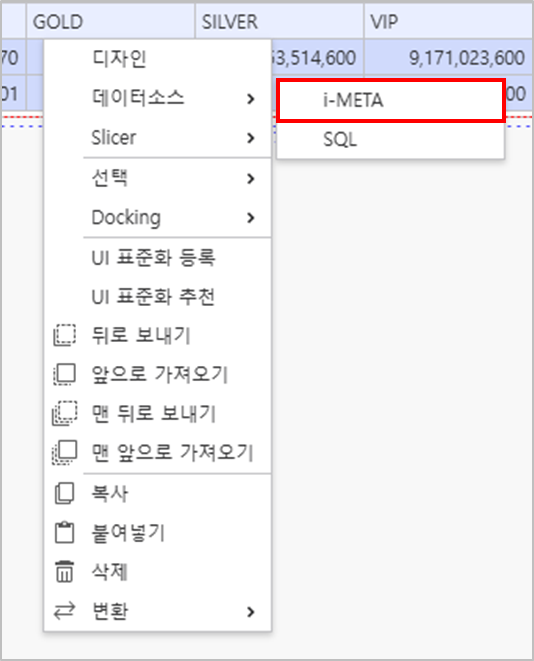
Connecting OlapGrid DataSource
Right-click the OlapGrid > DataSource > i-META > Select META file
- Sales Analysis Location : TBD > Sample > 3.Templates > OLAP > "Sales Analysis"
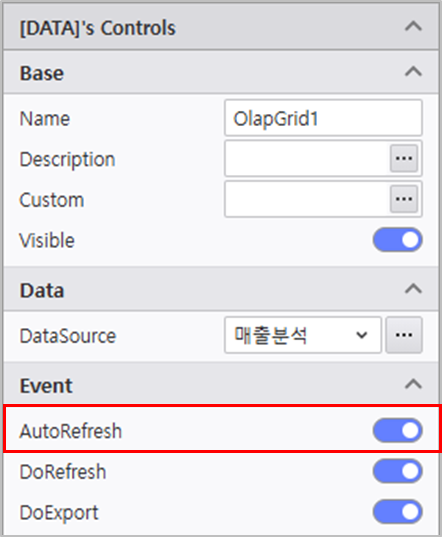
AutoRefresh Activation
Activate AutoRefresh in the property panel on the right of the OlapGrid.
Query Item Query Condition Variable - Column : [Customer Tier]
- Data : [Sales Cost, Revenue]
[YM] :VS_YM 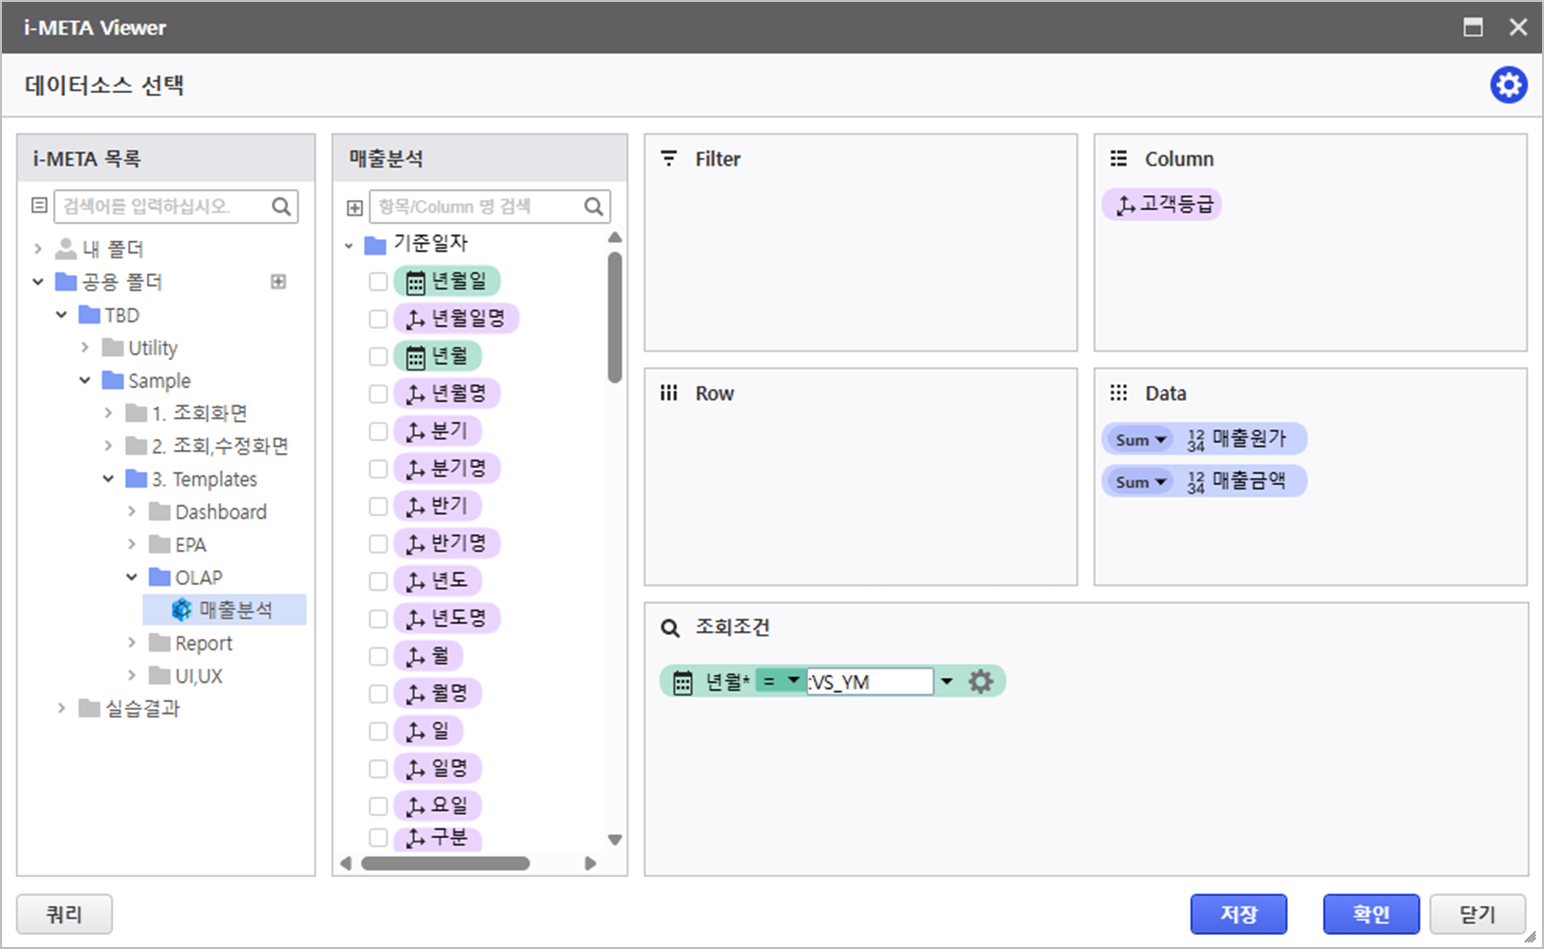
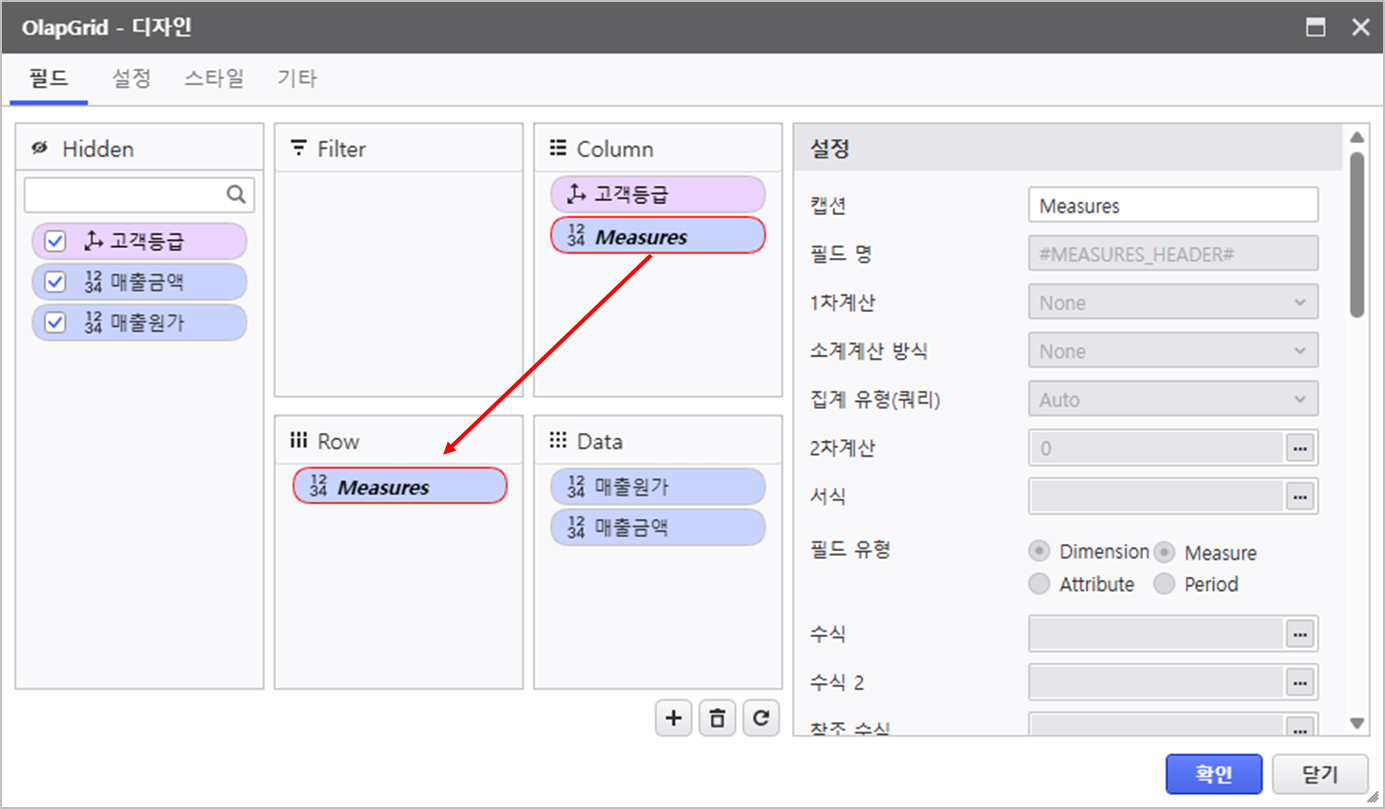
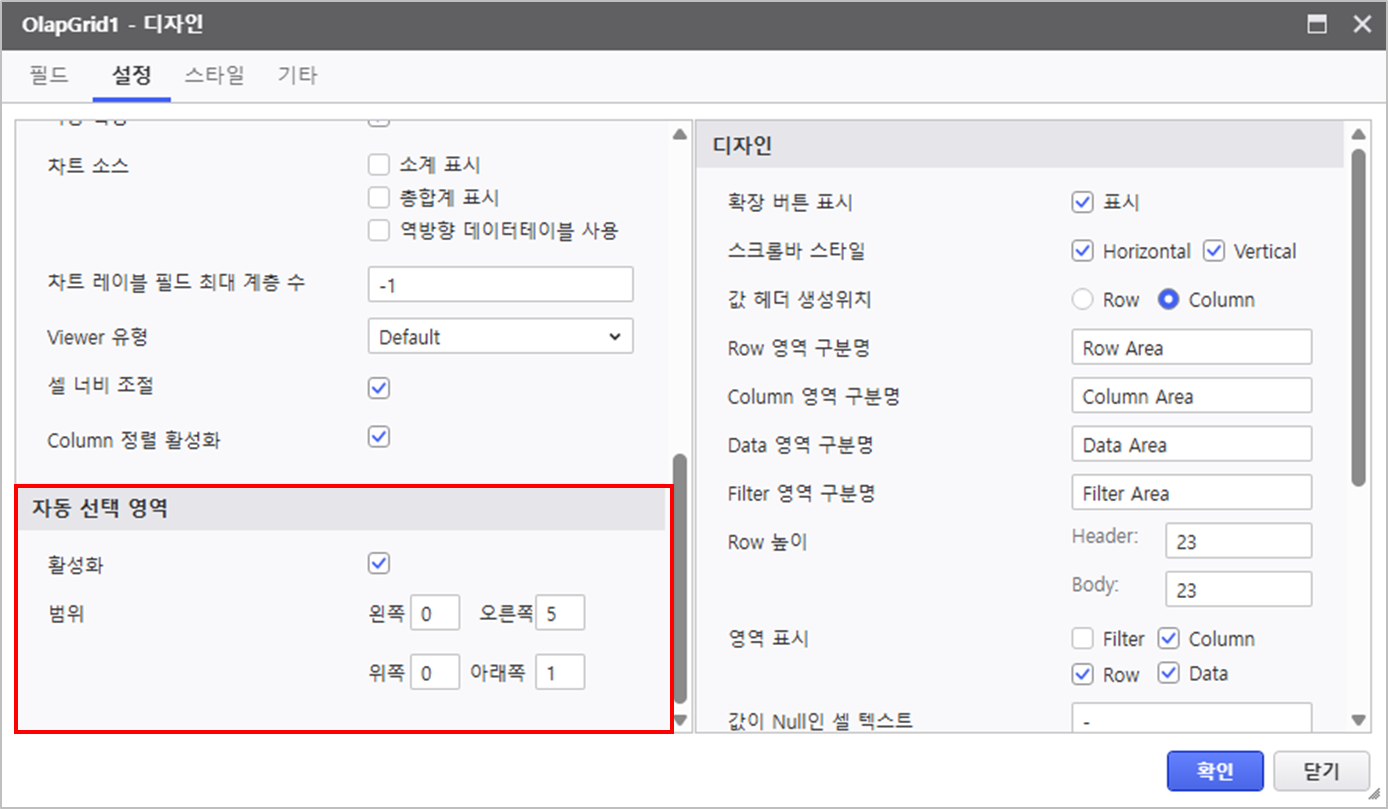
Right-click to open Design menu, and modify the design property.
Field Setting Other Settings - [Measures] field position changed :
Column > Row
- Enable auto selection area
- Range : Right 5, Down 1
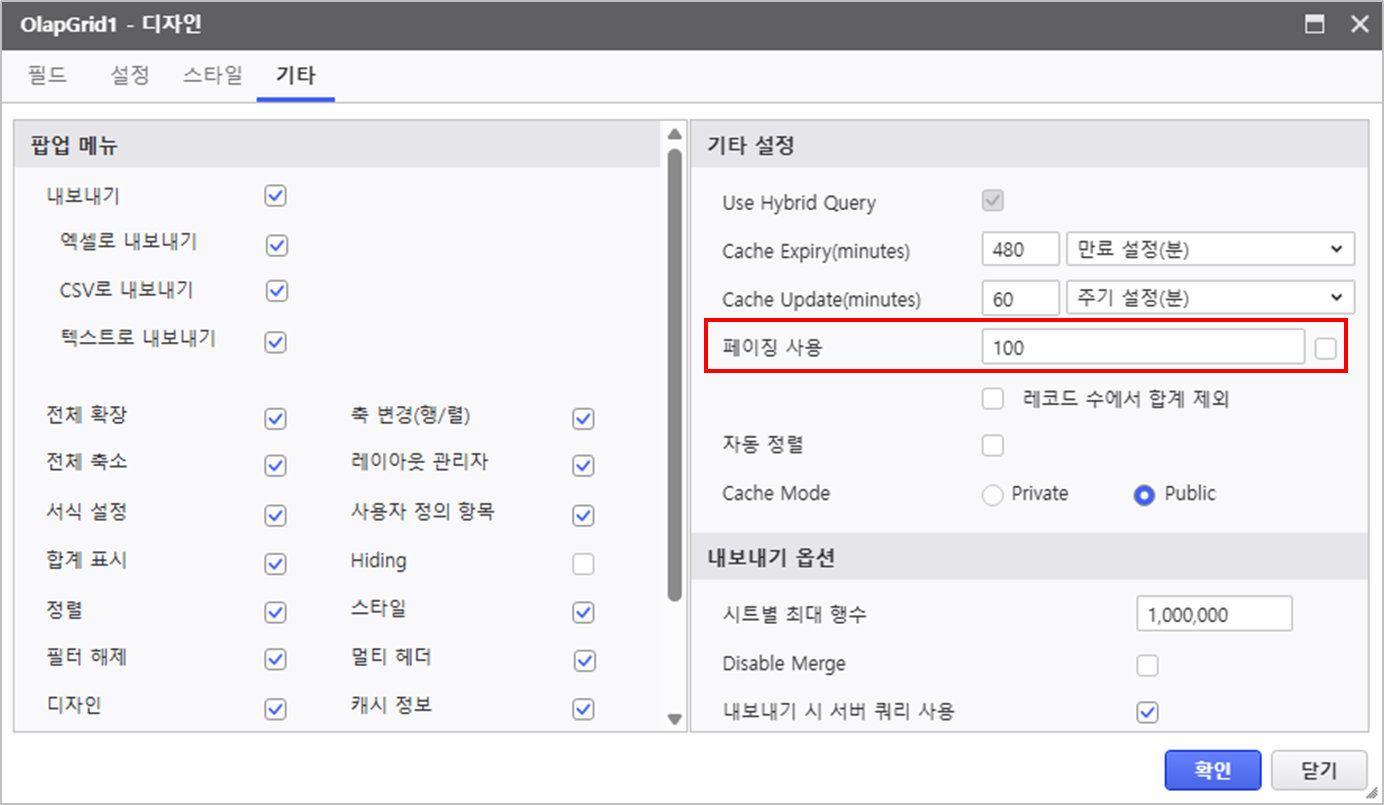
- Disable Using Paging
- [Measures] Field Position Changed : Column > Row
- Enable Auto Selection Area
- Disable Using Paging
- [Measures] field position changed :
2.2 Chart Configuration
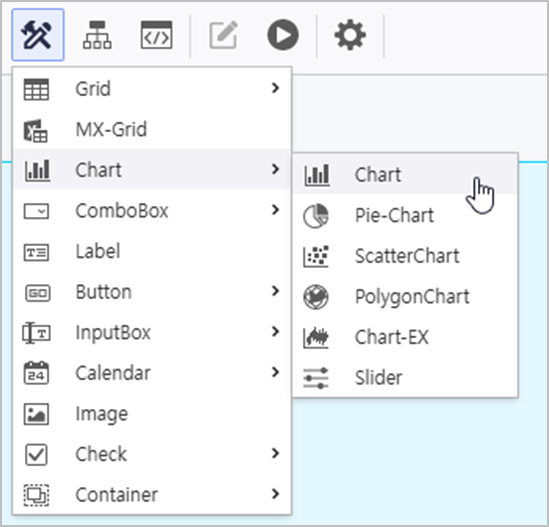
- Create a Chart Control
- Go to UI Bot > Chart, and select Chart
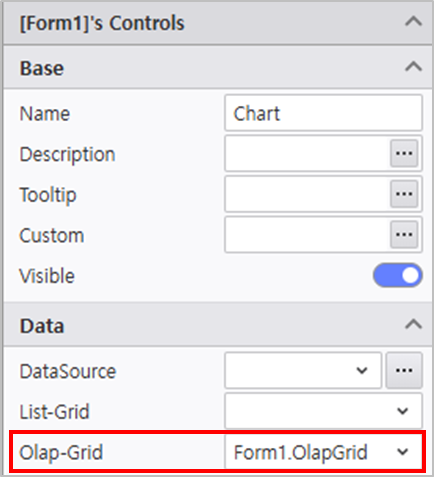
- In the property menu on the right, configure the Chart property.
- Olap-Grid : Form1.OlapGrid
Click the Design menu to modify the design property.
Default Series Axis Legend - Data Label : Value
- [Sales Cost] > Chart Type : Line Chart
- [Sales Cost] Axis : Y2
- [Sales Cost] > Other > Sort Label : TopCenter
- [Revenue] > Other > Sort Label : BottomCenter
- Y1 Axis : Display Disabled
- X Axis > Design : Major Grid Line width 0
- Position : Top, Right
- Direction : Horizontal
Verify that the report is working as expected.
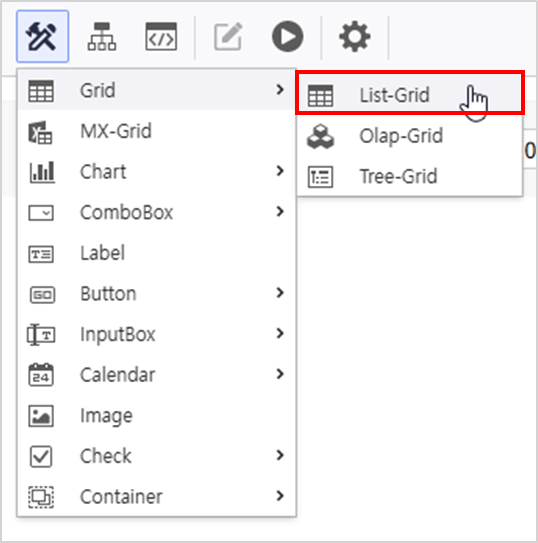
Step 3. Set ListGrid
Set a ListGrid to display Detailed Sales Performance.
- Go to UI Bot > Grid and create a ListGrid.
- Set properties of the ListGrid.
- Name : DG_DETAIL
- AutoRefresh : Activate
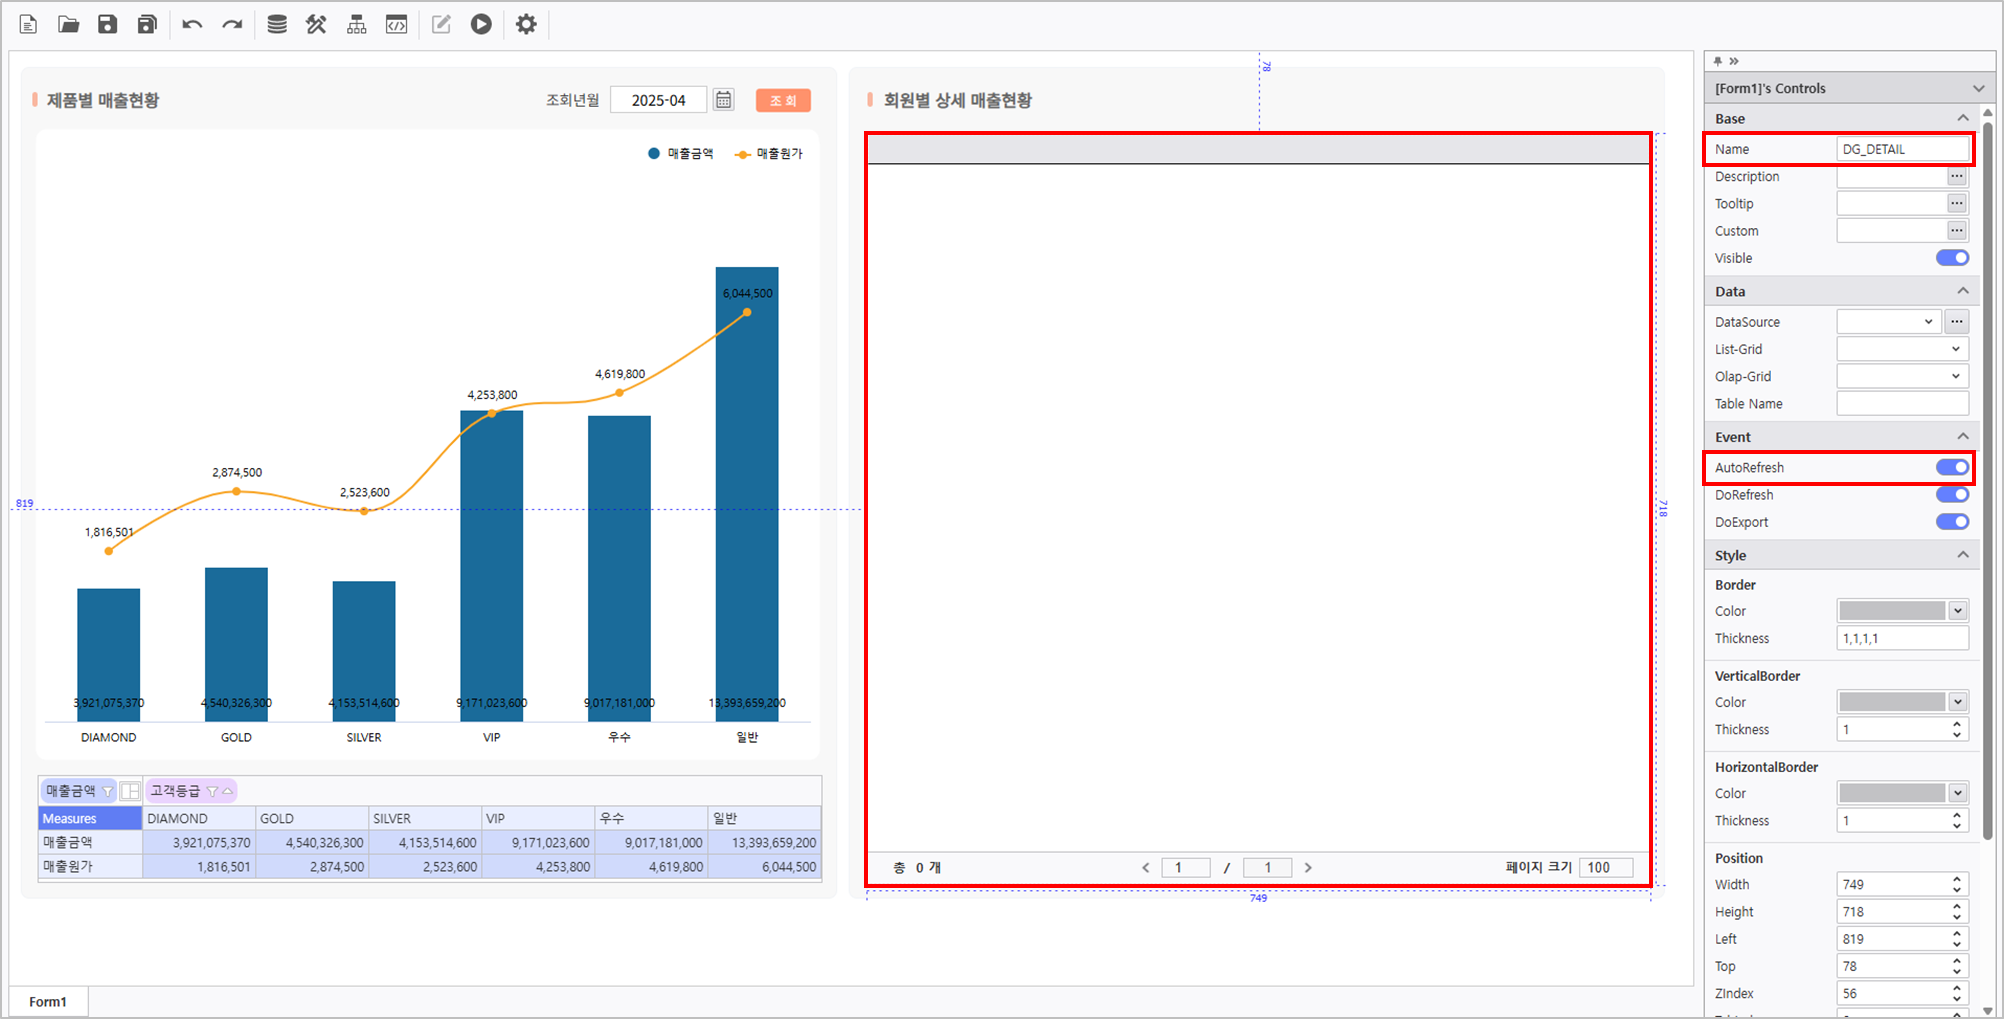
Connect data source using Sales Analysis META, and activate AutoRefresh.
Query Item Query Condition Variable [Customer Tier, Product Category, Product Subcategory,
Sales Quantity, Unit Cost, Unit Price, Revenue][YM]
:VS_YM [Customer Tier] @:VS_LEVEL 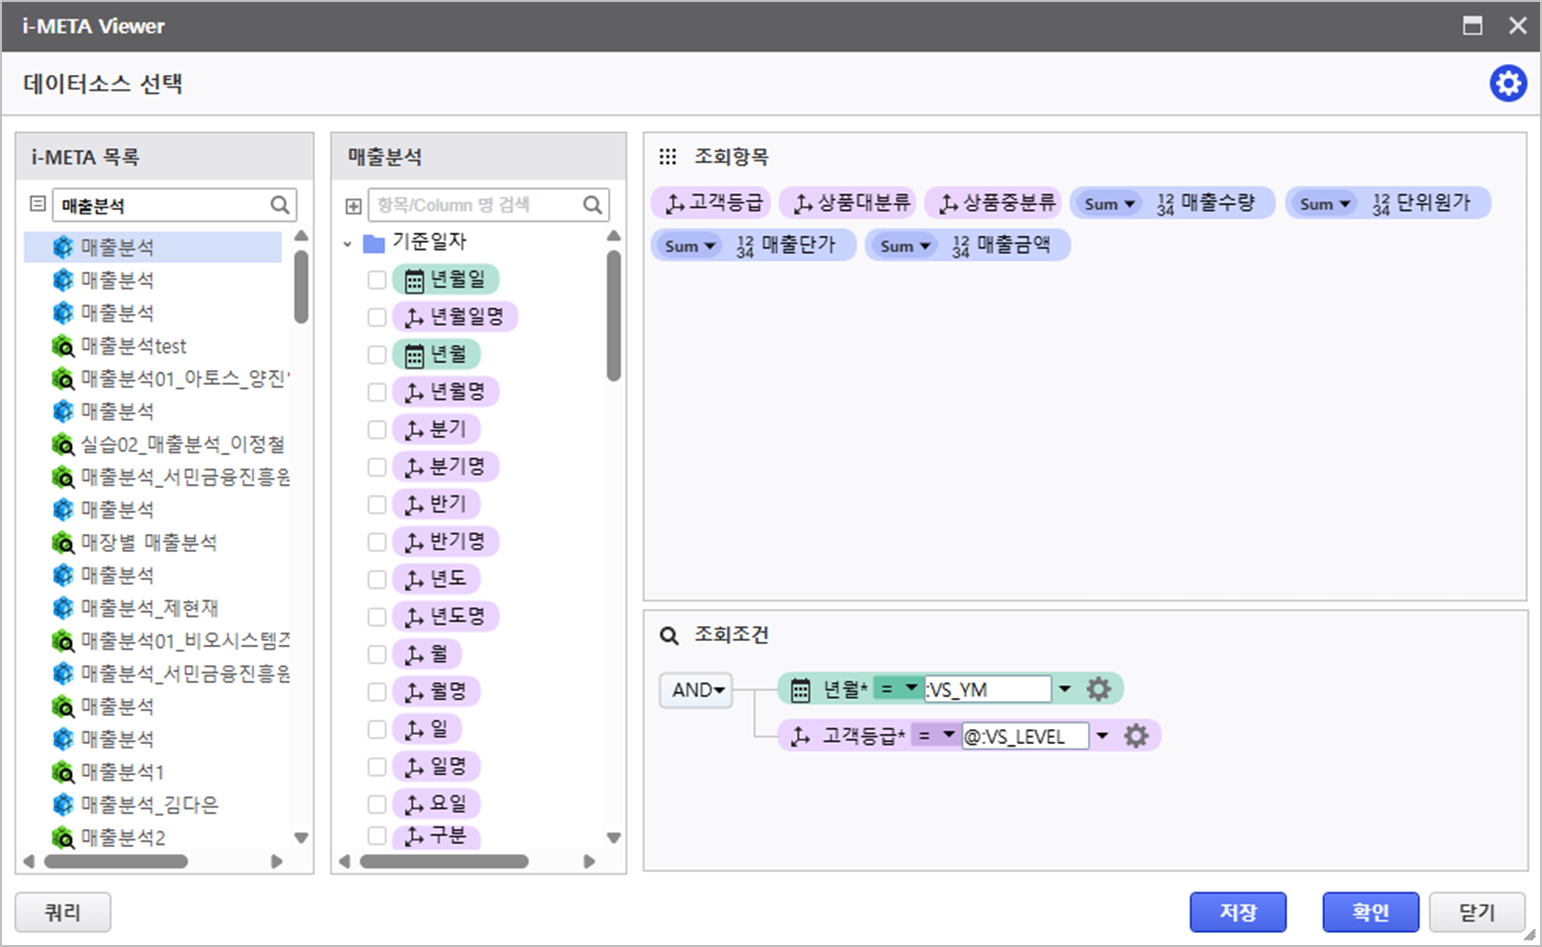
Setting Variable Names
For more information about AUD Platform Variables, please click here.
- VS_YM :
Variable for querying data based on date value of the Calendar Control
- VS_LEVEL :
Variable for querying ListGrid value based on [Customer Tier] data.
Step 5. Utilizing in Script Editor
- VS_YM :
Click the Design Menu, to modify the design property.
Setting > Default Setting > Group - View Header > Row : Disable
- Group : [Customer Tier, Product Category, Product Subcategory]
- Subtotal Position : Top
- Grand Total Position : Top
Verify that the report is working as expected.
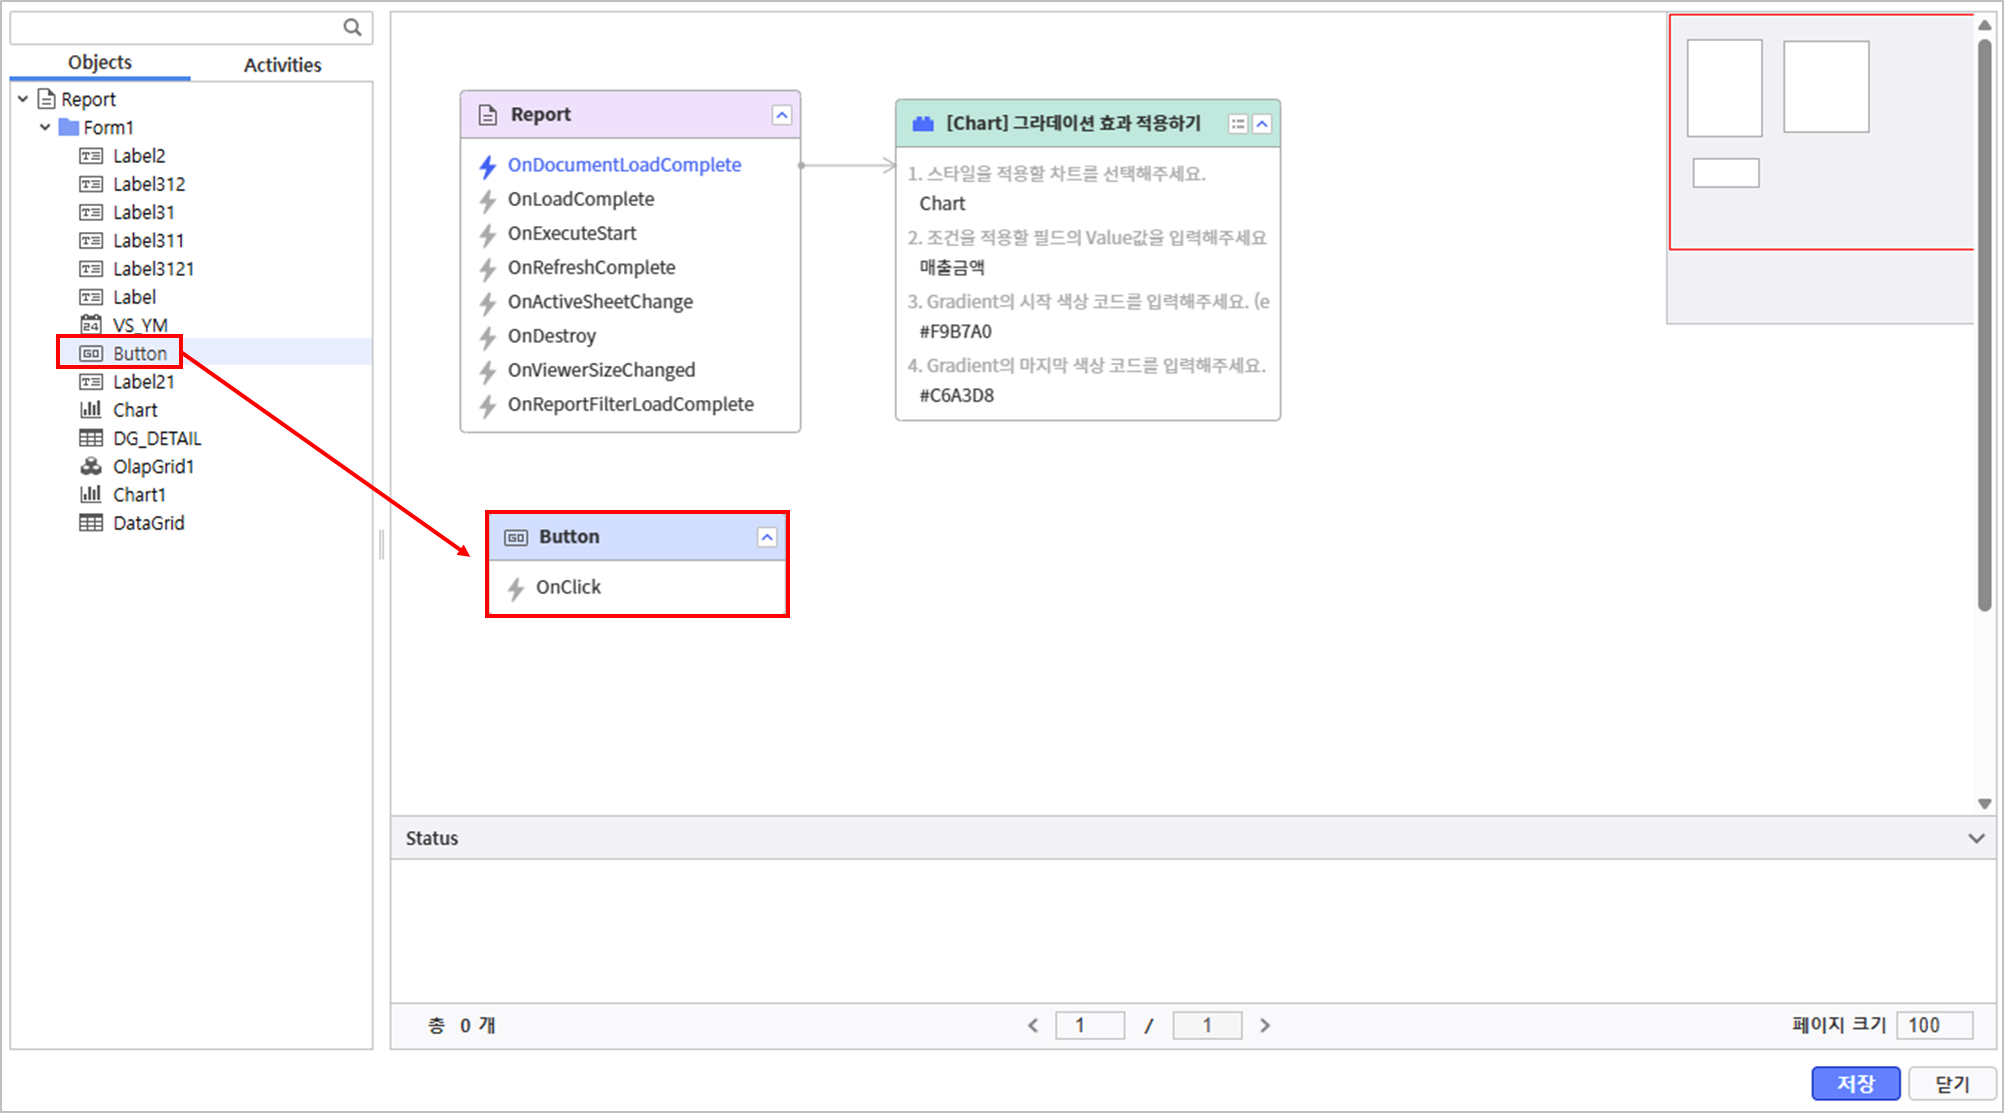
Step 4. Utilizing Process Bot
Set a module for Chart Design Effect and Report Update.
4.1 Chart Gradient Effect Application Module Setting
- Click the Process Bot icon at the top.

- In the Object tab, double-click and place the Report.

- Load a module that sets the Chart gradient effect, connect with OnDocumentLoadComplete event of the Report,
and click Number 4 icon for parameter setting.- Module Name : "[Chart] Gradient Effect Application"

- Set the parameters of the module as below and Click Save button.
- Target Chart for Style Application : Chart
- Field Value to Apply Condition : [Sales Amount]
- Gradient Start Color Code : #F9B7A0
- Gradient End Color Code : #C6A3D8

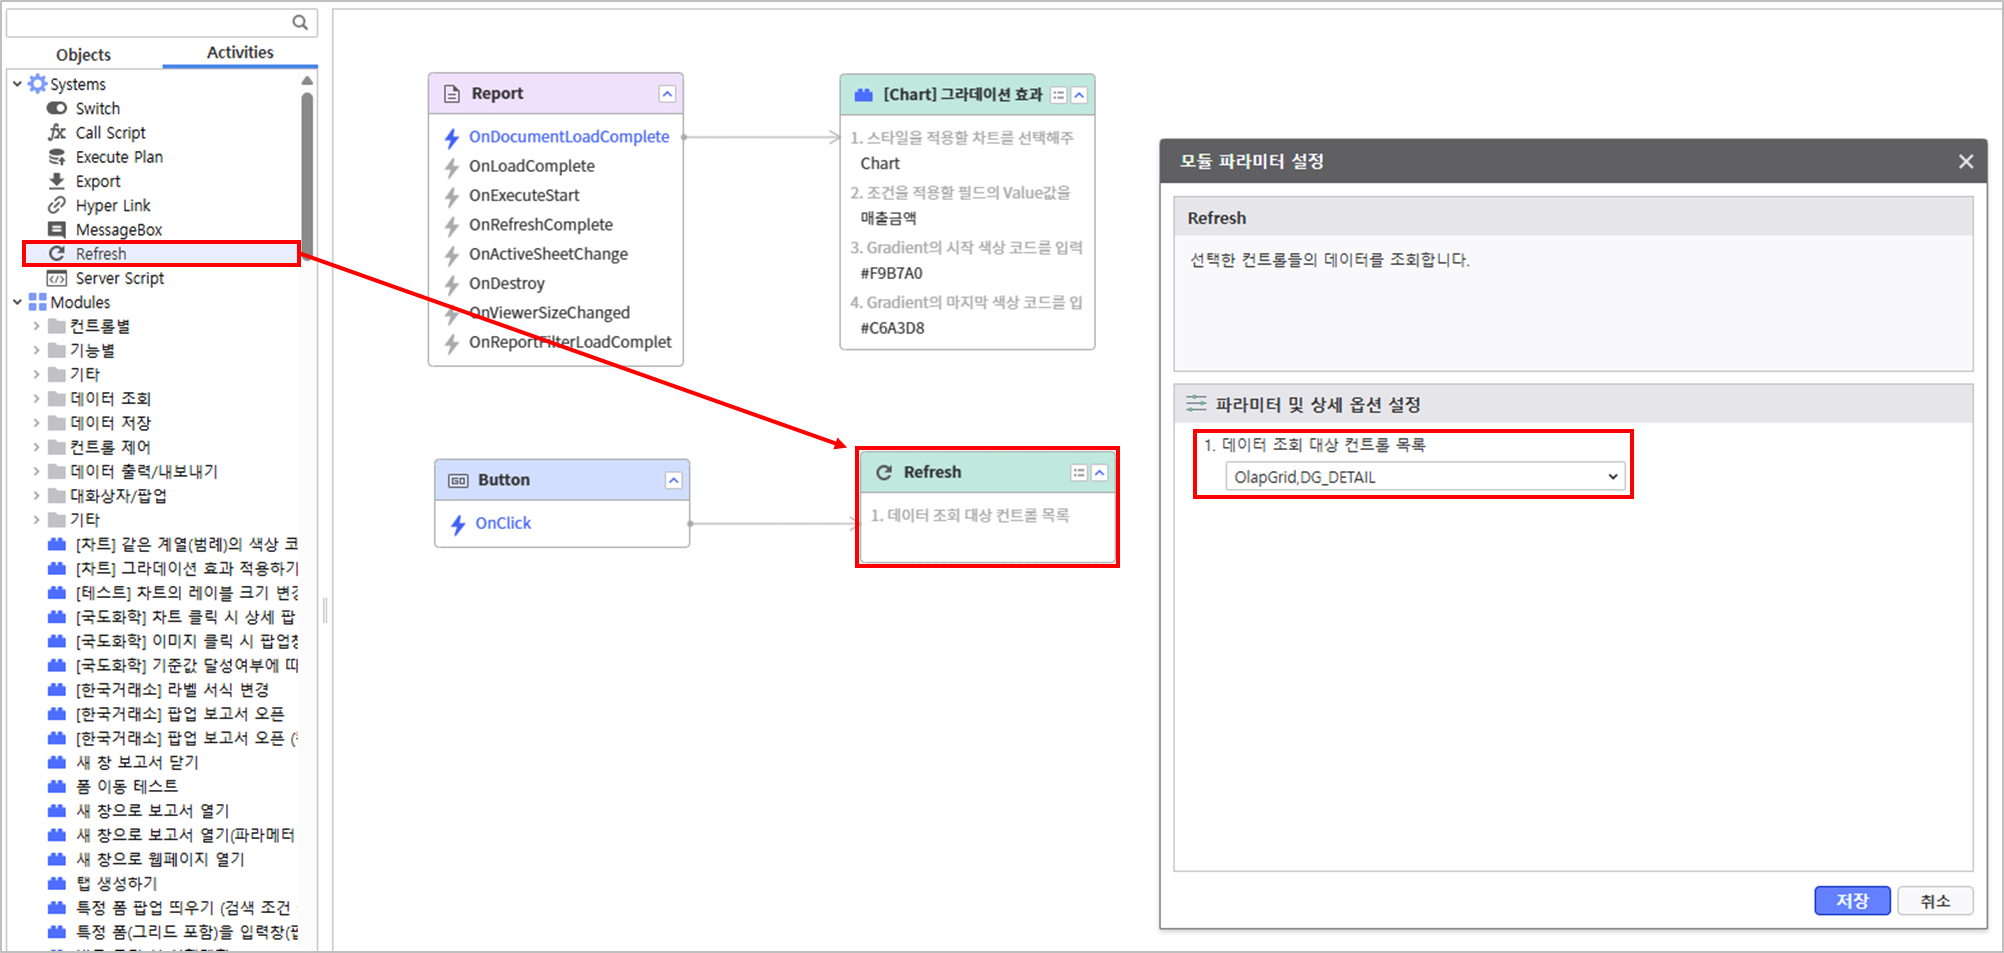
4.2 Refresh for Query Button Module Setting
- In the Process Bot > Object tab, select and place a Button.
- In the Activities tab, click system module, Refresh, connect with Button's OnClick event, and set query target parameter.
- Query Target Control List : OlapGrid, DG_DETAIL
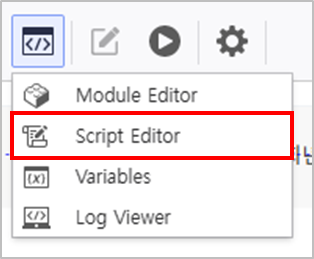
Step 5. Utilize the Script Editor
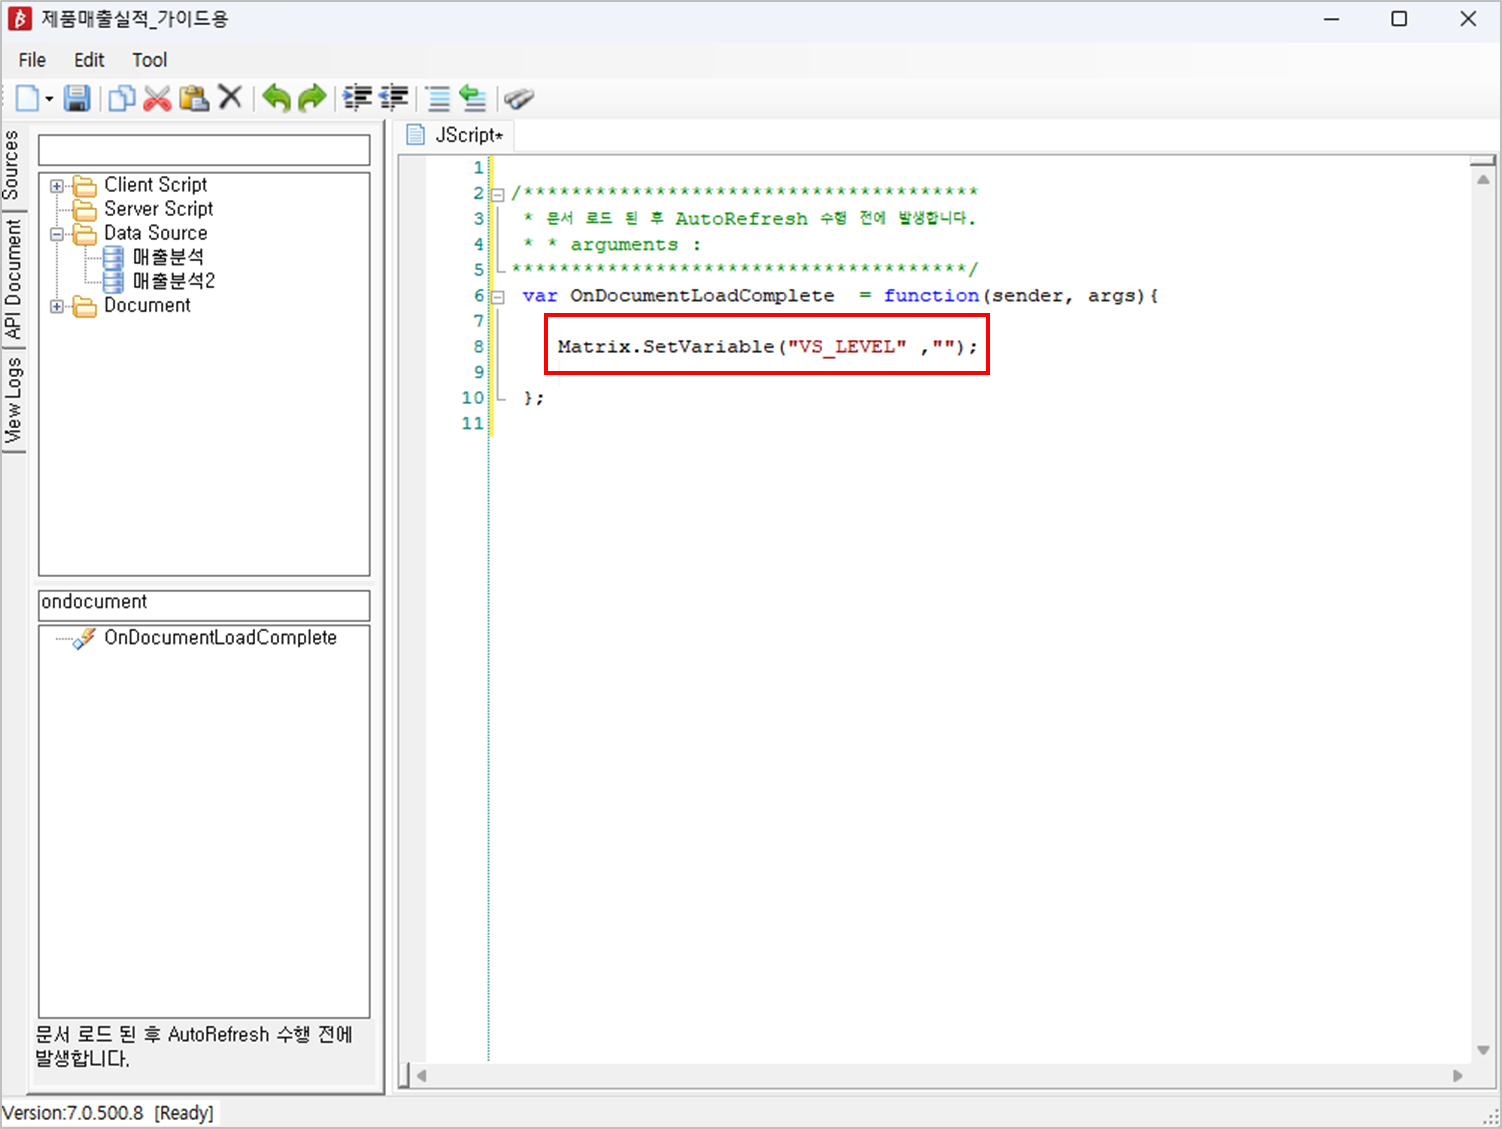
5.1 Writing a Variable Initializing Script
- In the report's top menu, click Edit Group > Script Editor.
- Search and double-click an API to use.
- API to Use : OnDocumentLoadComplete

Write the following script to initialize a variable.
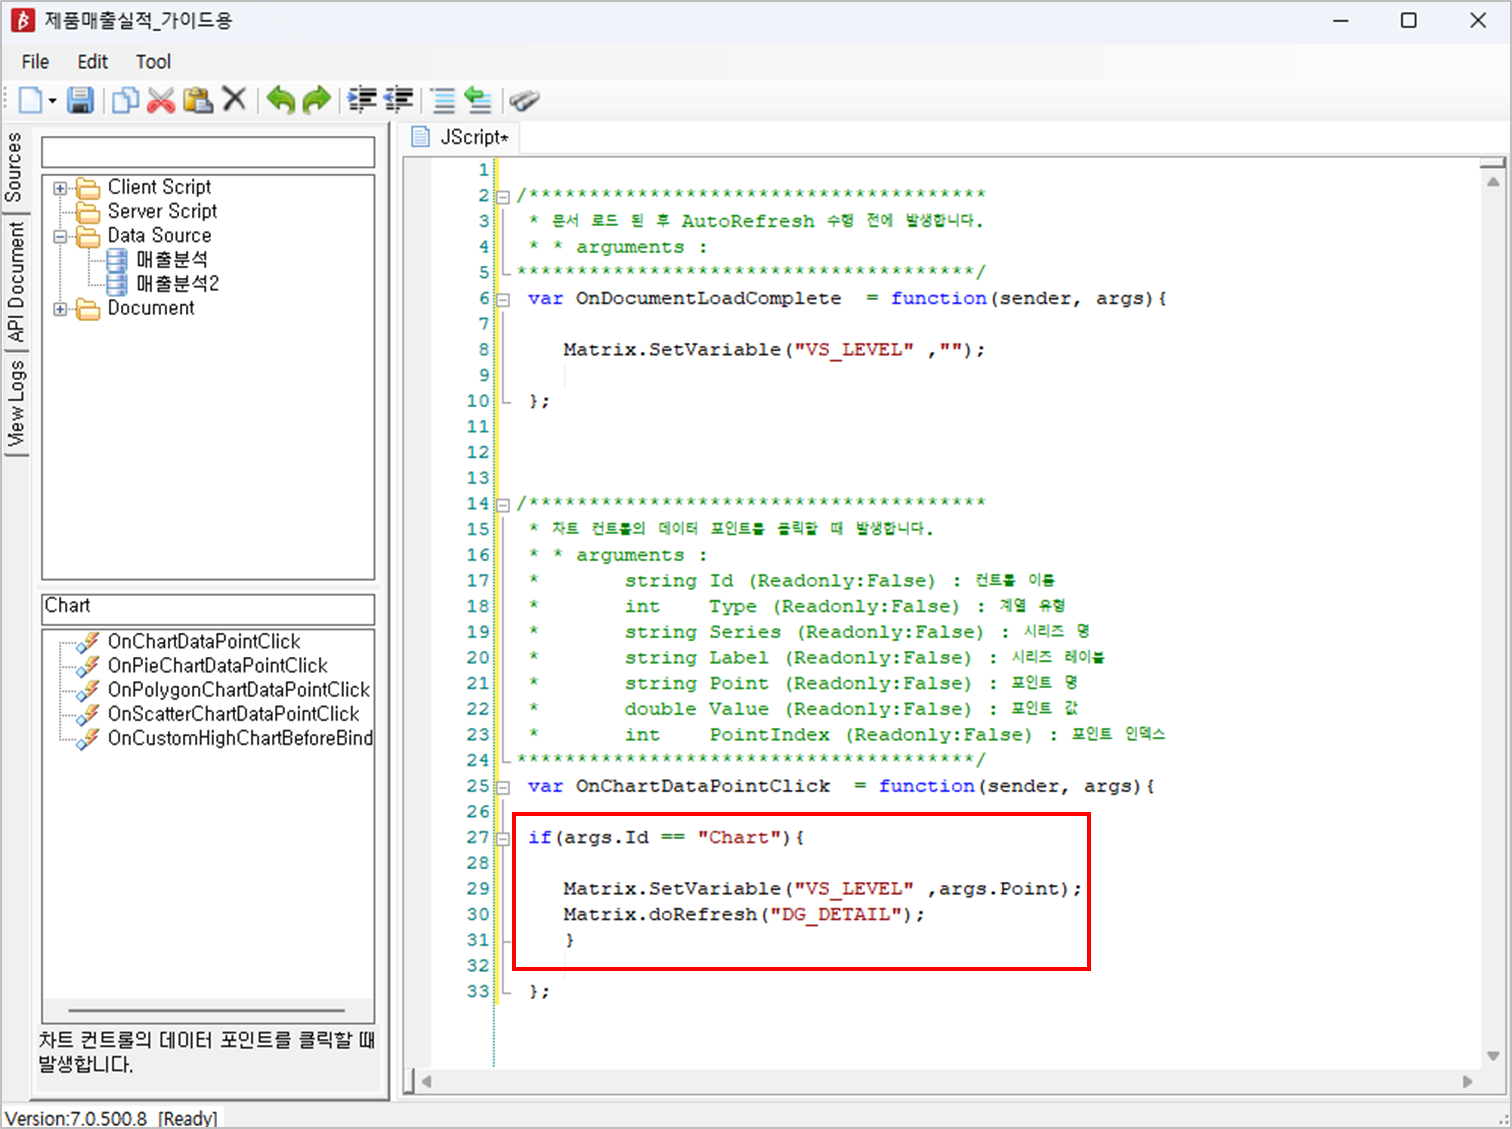
5.2 Write a Script to Refresh the DataGrid when a Chart is Clicked
- Search and double-click an API to use.

Write a script for an event when the Chart is clicked.
Verify that the report is working as expected.