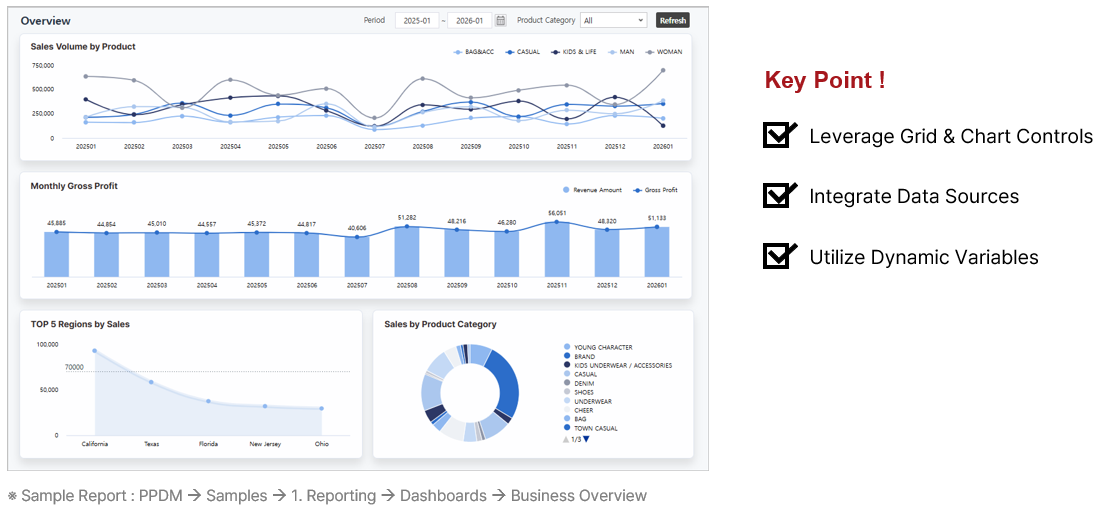
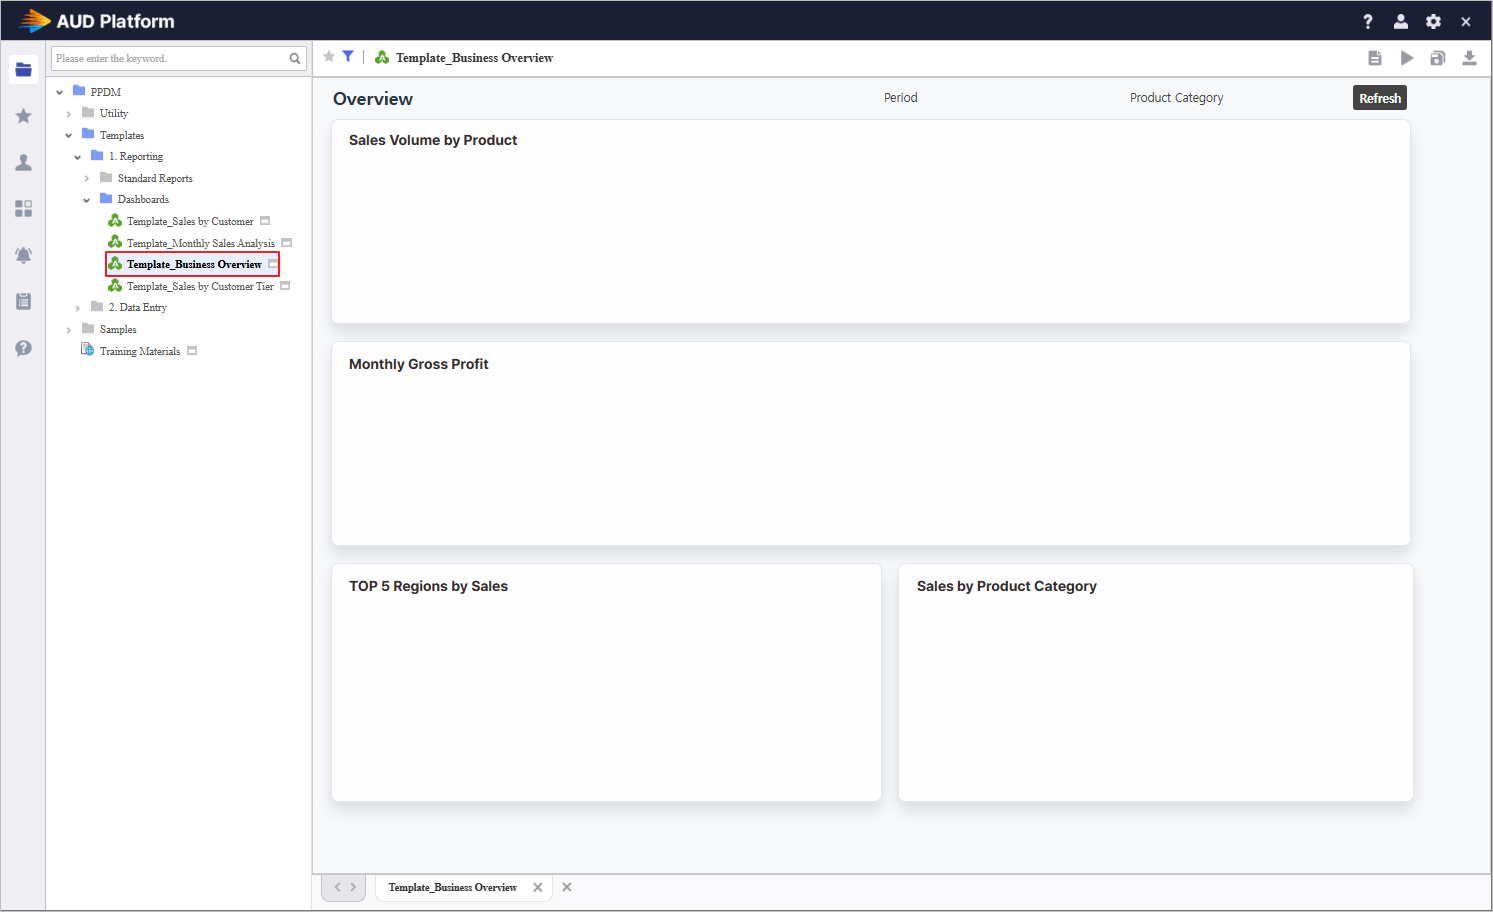
Target Screen |
|---|
|
Template Report Information Download Practice Template To study the practice example above, use the following report by saving it with a new name.
|
Step 1. Establish Inquiry Controls
Define the foundational inquiry components to drive dynamic data filtering.
1.1 Instantiate Components
- Access the [UI Bot] menu to generate ComboBox, Calendar, and Label controls on the Designer.
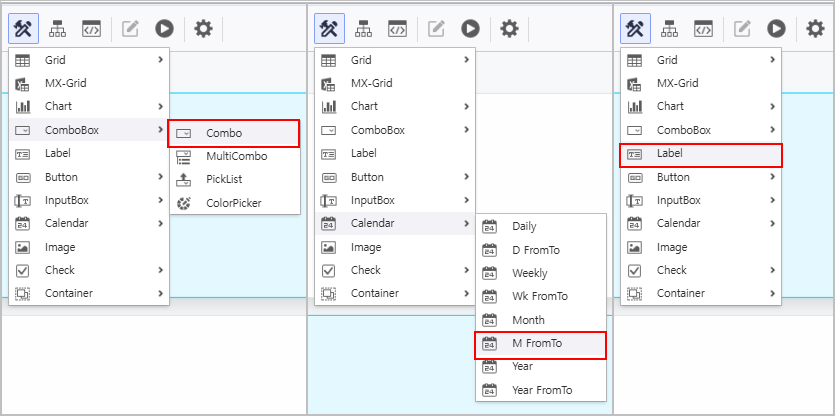
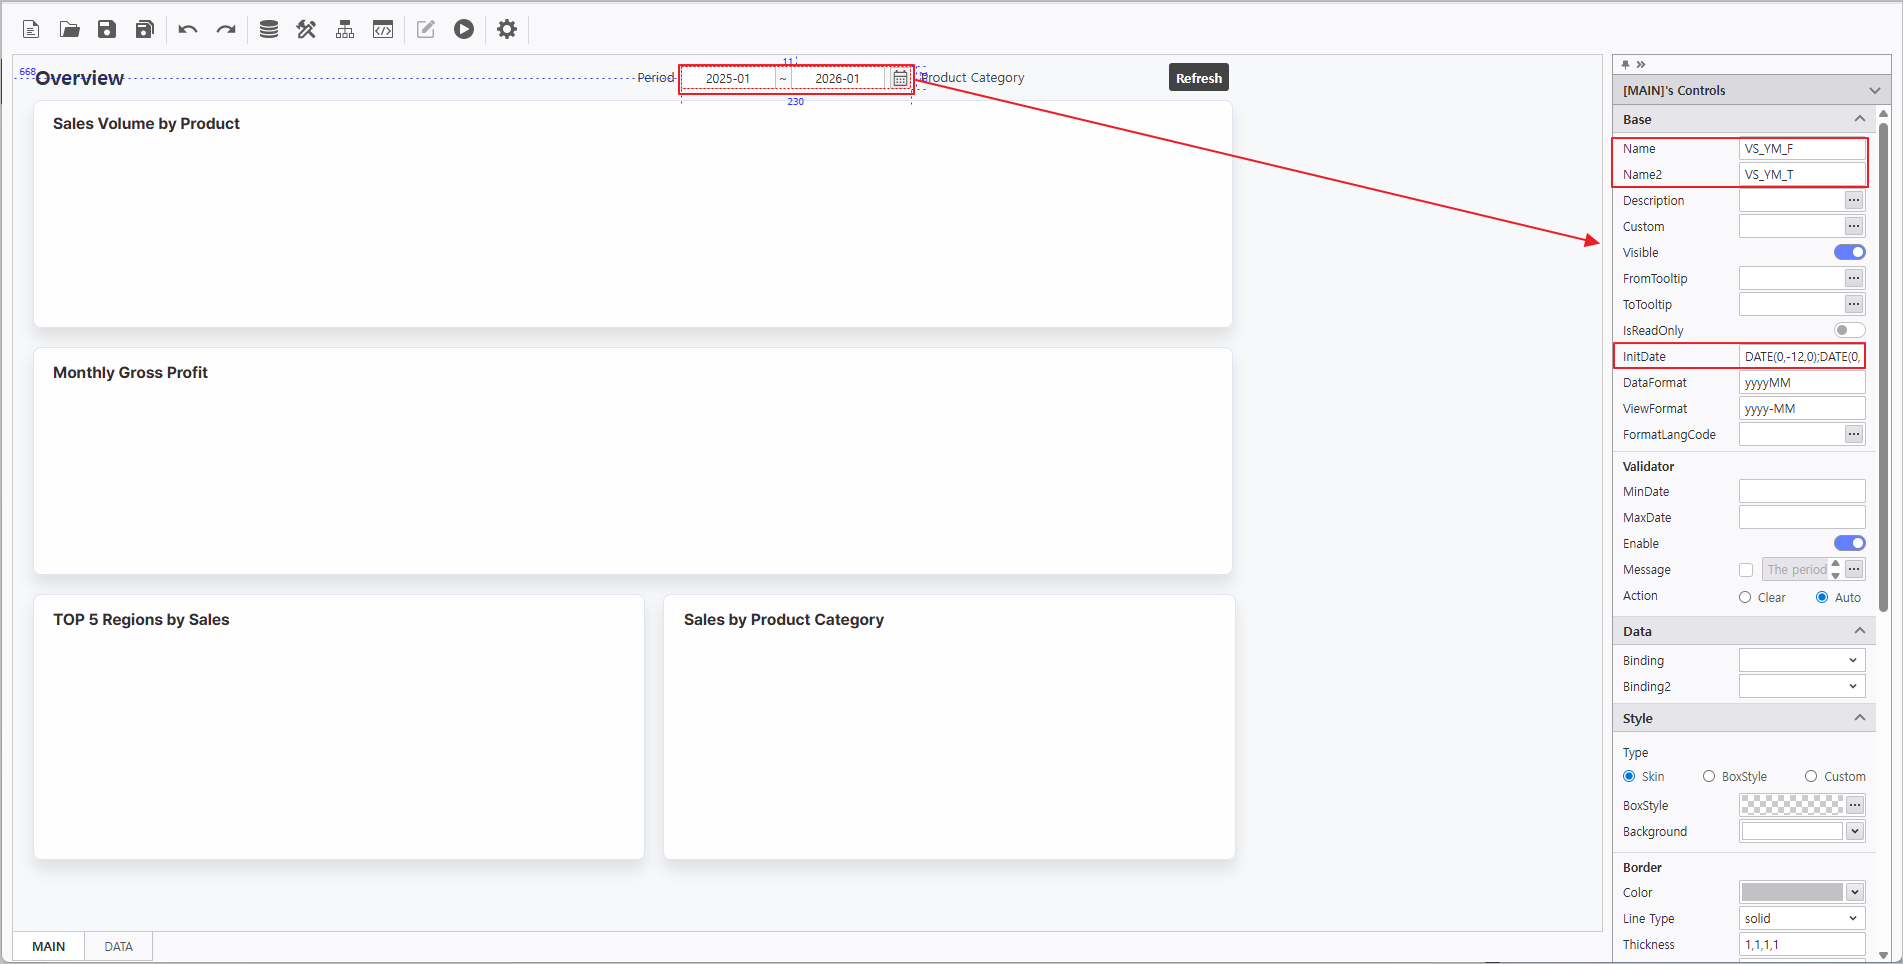
1.2 Attribute Configuration
- In the Property Editor on the right, configure the Calendar attributes as follows:
- Name : VS_YM_F
- Name2 : VS_YM_T
- InitValue : DATE(0,-12,0);DATE(0,0,0)
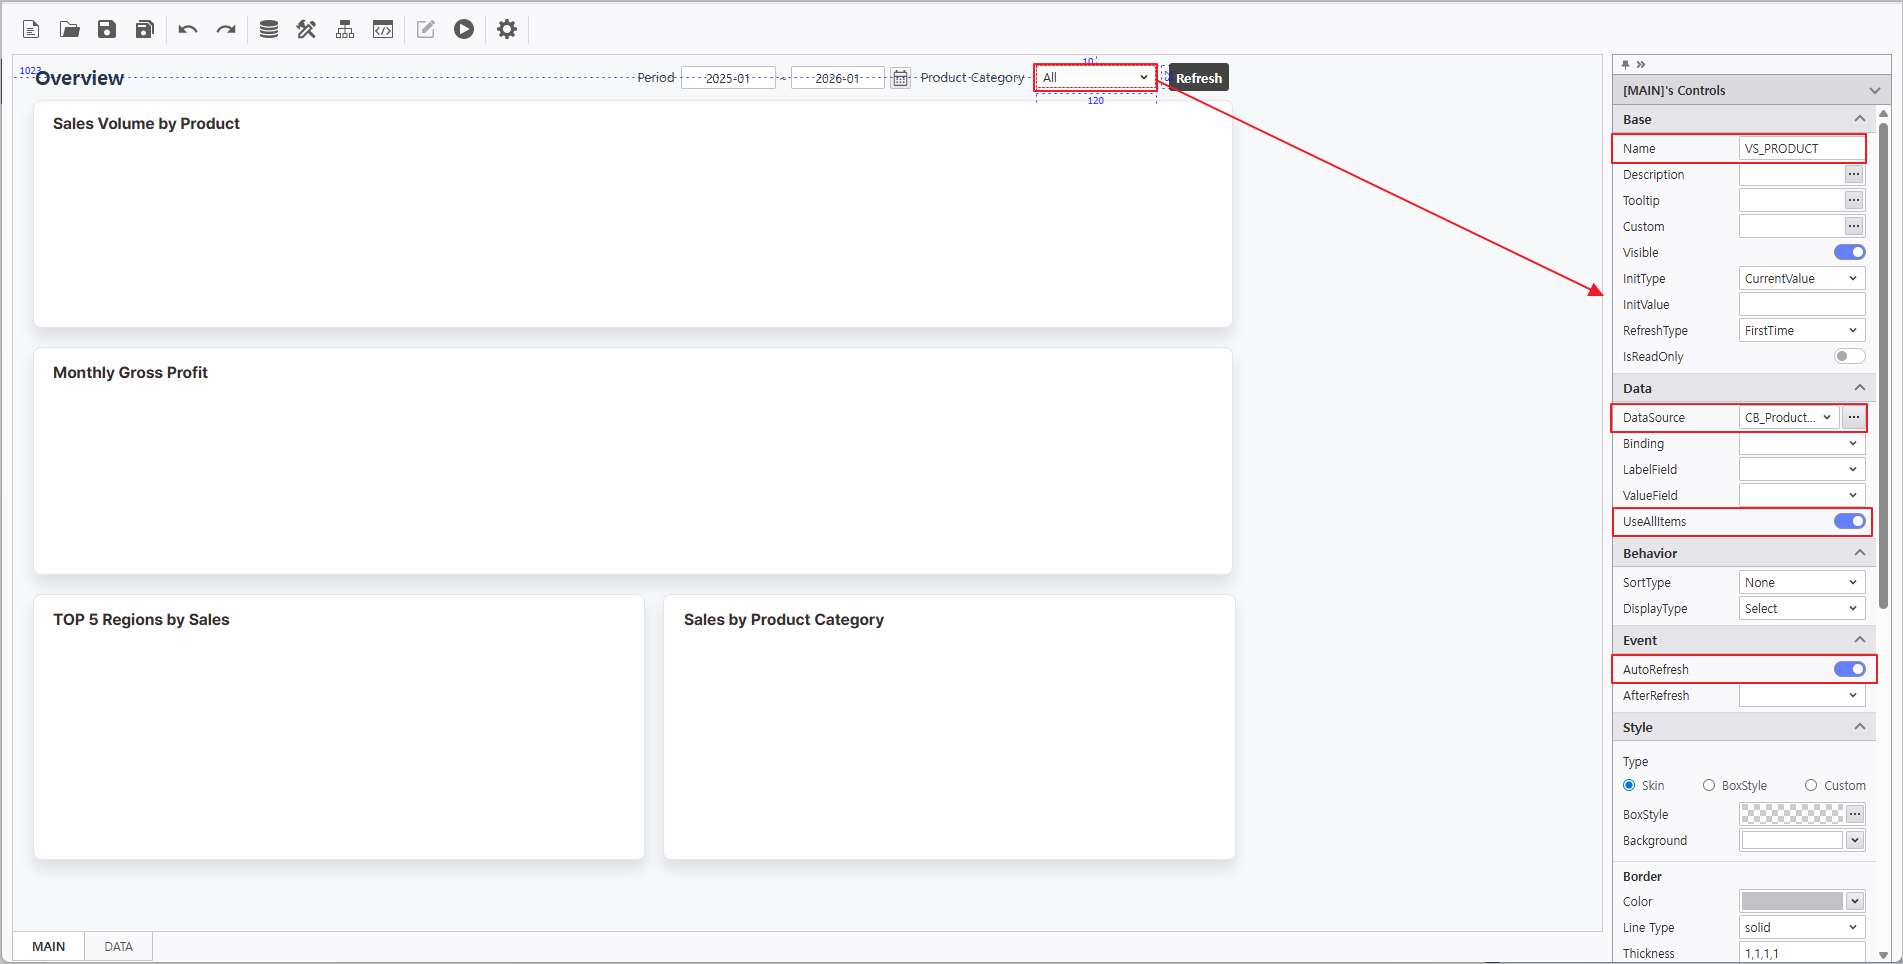
- In the Property Editor on the right, configure the ComboBox attributes as follows:
- Name : VS_PRODUCT
- DataSource : CB_ProductCategory
 More > SQL > "CB_ProductCategory"
 - Enable UseAllItems
- Enable AutoRefresh
In the Property Editor on the right, configure the Label attributes:
Name Text LB_Period Period LB_ProductCategory Product Category
Step 2. Synchronize Chart and OlapGrid
Leverage chart attributes to link data from the OlapGrid.
2.1 OlapGrid Configuration
- Navigate to the DATA Form at the bottom of the report.
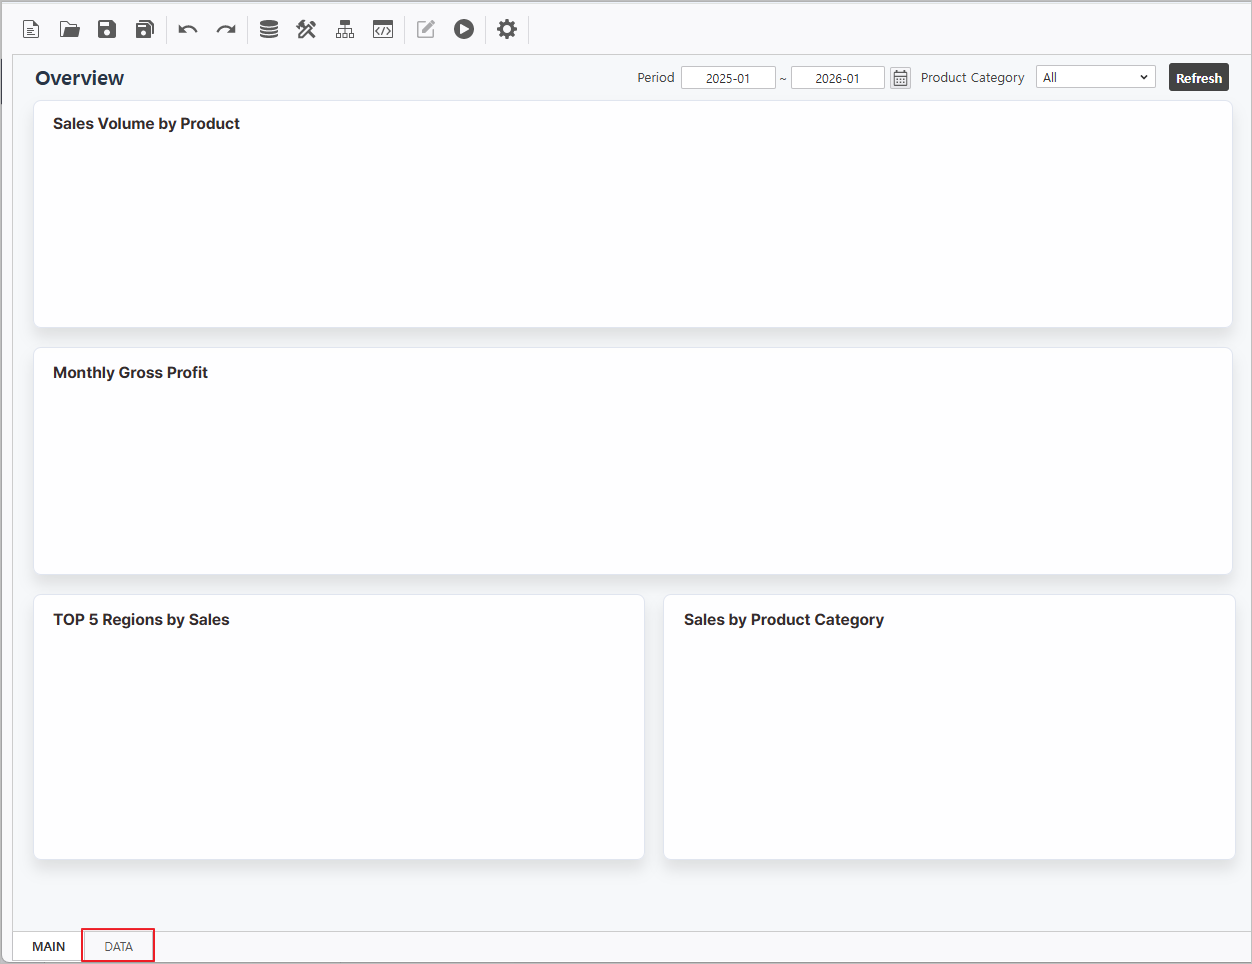
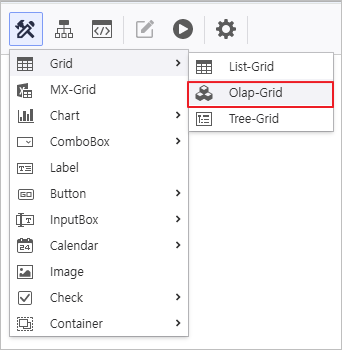
- Create an OlapGrid control.
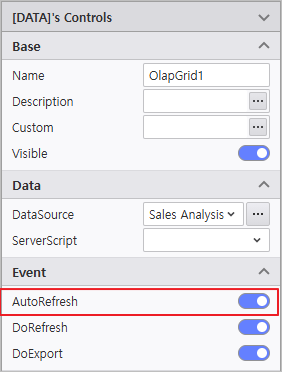
Connect Data Source to OlapGrid & Enable AutoRefresh.
OlapGrid DataSource Connection
Right-click OlapGrid > DataSource > i-META > Select Sales Analysis META file
▪ Sales Analysis Path : Public Folder > PPDM > Samples > 3. i-META > Sales Analysis
Enable AutoRefresh
Select each OlapGrid and activate AutoRefresh in the properties pane on the right.
Name Query Items Query Conditions Operator Variable Names OlapGrid1 - Column : [YearMonth]
- Row : [Product Category]
- Data : [Quantity]
[YearMonth] BETWEEN :VS_YM_F ~ :VS_YM_T [Product Category] = @:VS_PRODUCT OlapGrid2 - Column : [YearMonth]
- Data : [Revenue Amount, Sales Cost]
[YearMonth] BETWEEN :VS_YM_F ~ :VS_YM_T [Product Category] = @:VS_PRODUCT OlapGrid3 - Column : [Region]
- Data : [Revenue Amount]
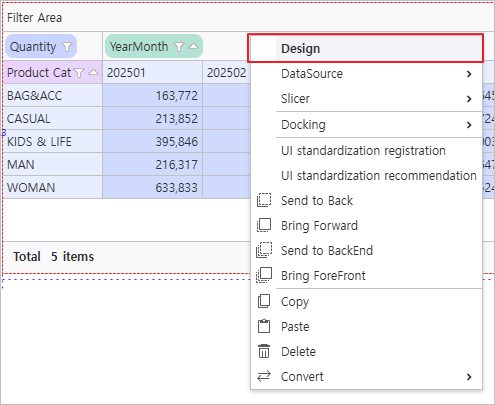
[YearMonth] BETWEEN :VS_YM_F ~ :VS_YM_T Right-click the OlapGrid to launch the Design menu and modify design attributes.
Name Field Field > Calculated Field Option > Auto Selection Area
OlapGrid1 - - - Enable Auto Selection Area
- Range : Right 12, Bottom 4
OlapGrid2 - Change [Measures] Field Position :
Column > Row
- Caption : Gross Profit
- Format : {0:N0}
- Formula : [Revenue Amount] - [Sales Cost]
- Enable Auto Selection Area
- Range : Right 12, Bottom 2
OlapGrid3 - Change [Region] Field Attribute :
Click More at Sort Attribute
- - Enable Auto Selection Area
- Range : Right 4
Add Calculated Field
Navigate to Design > Field and click the Add
 icon to generate calculated fields.
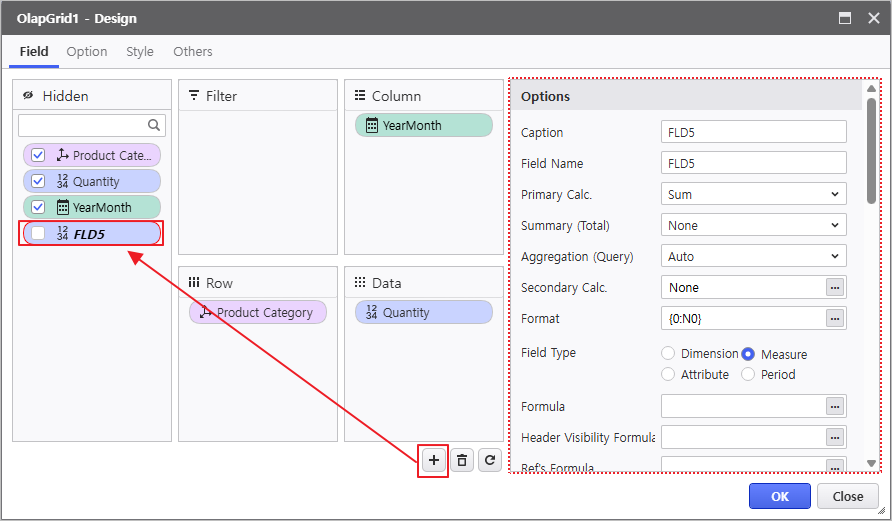
2.2 Chart Configuration
- Navigate to the MAIN Form at the bottom of the report.
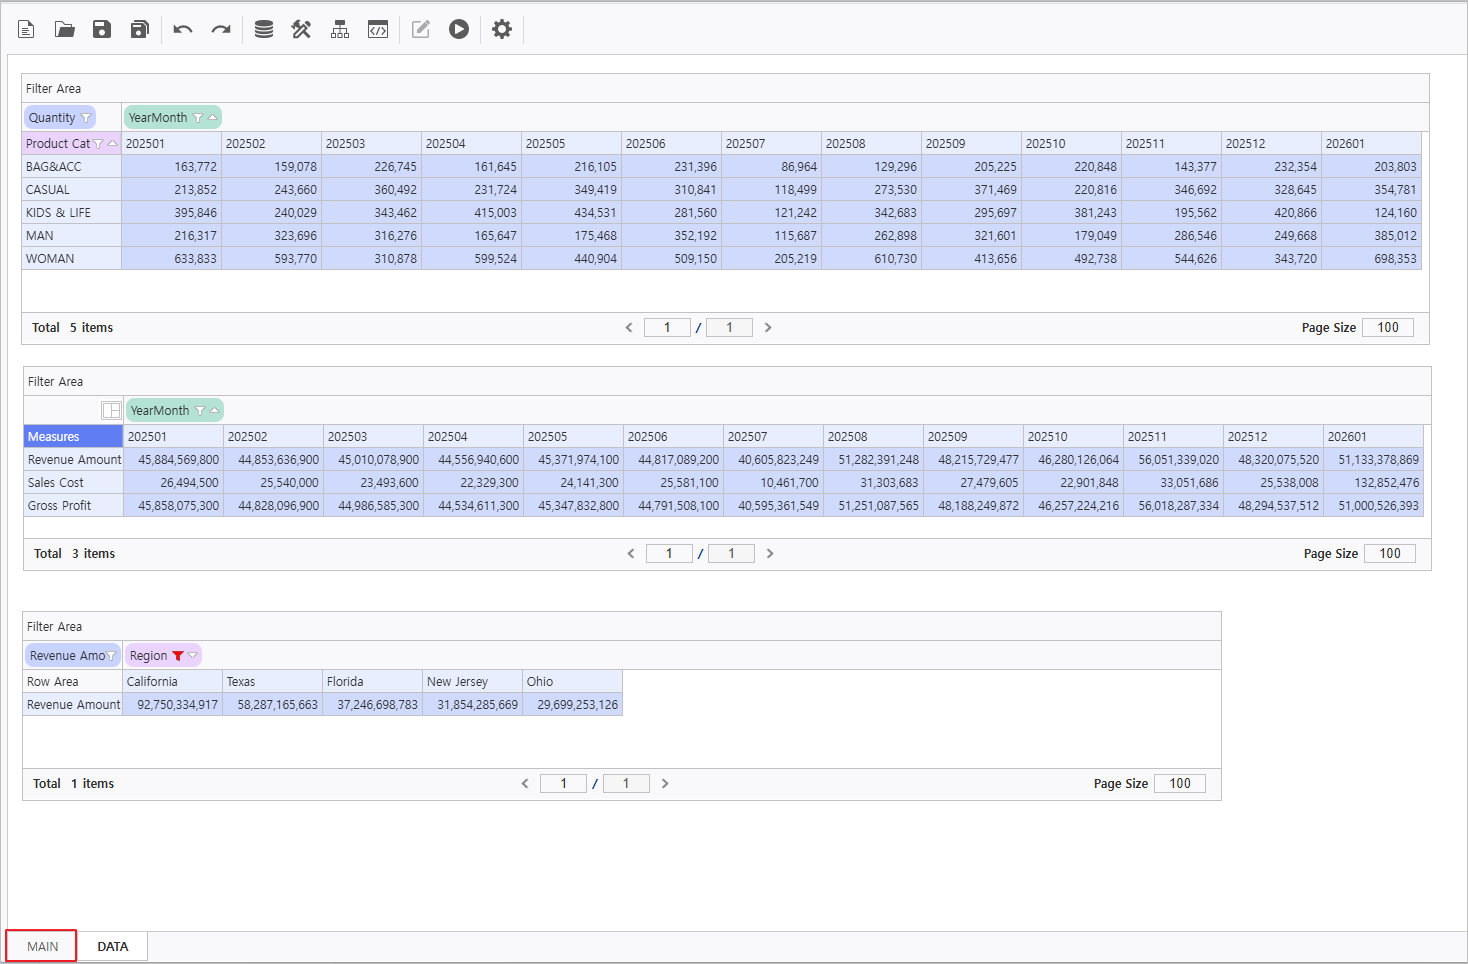
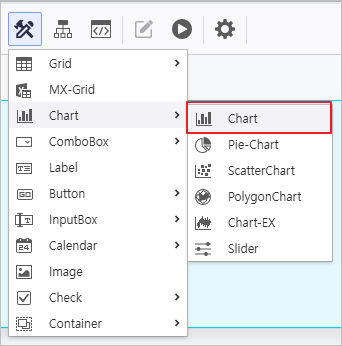
- Instantiate Chart controls within the MAIN Form.
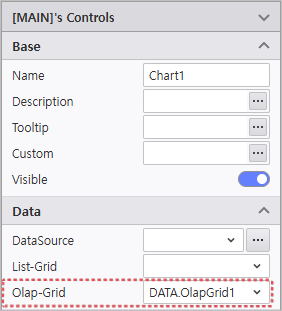
Select each Chart control to update its Name in the property menu and link it to the OlapGrid created in the DATA form.
Name Data > OlapGrid Chart1 DATA.OlapGrid1 Chart2 DATA.OlapGrid2 Chart3 DATA.OlapGrid3 OlapGrid Binding
Select each Chart and designate the target Grid in the OlapGrid property field.
Click the Design menu to modify visual attributes.
Name Control Area Basic > Chart Type Series Axis Legend Chart1 Sales Volume by Product Spline - - - Position : Top, Right
- Direction : Horizontal
Chart2 Monthly Gross Profit - - Sales Cost : Deactivate Visible
- Gross Profit Chart Type : Spline
- - Position : Top, Right
Chart3 TOP5 Regions by Sales Area Spline - Style :
Background Color > Transparency > 0.1
Symbol Type > Circle
Symbol Color > #8fb8f0 - Others : Unit > 1000000(Million)
- PlotLines :
Line Color > #2a3a47
Line Style > Dot
Line Width > 1
Display Criteria > 70000
Enable Criteria Visible
- Position : Top, Right
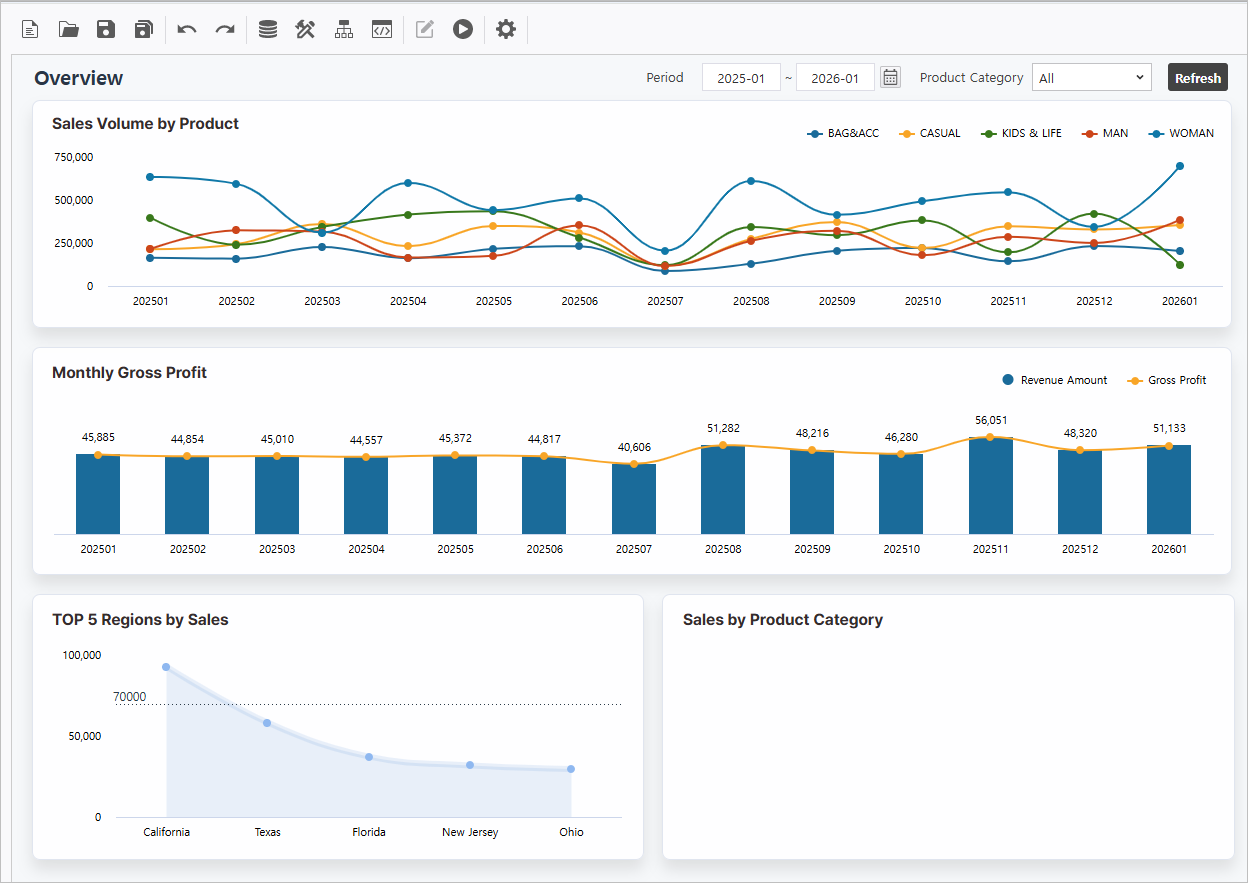
Verify the report is functioning correctly.
Step 3. Create PieChart
Develop a Doughnut Chart to visualize the current sales status by product category.
- Create a Pie-Chart control.

- Modify the control attributes
- Name : PieChart
- Enable AutoRefresh
Bind the data source using the Sales Analysis META file.
Query Items Query Conditions Operator Variable Names [Product Subcategory, Revenue Amount] [YearMonth] BETWEEN :VS_YM_F ~ :VS_YM_T [Product Category] = @:VS_PRODUCT - Change Chart Type
- Chart Type : Doughnut Chart
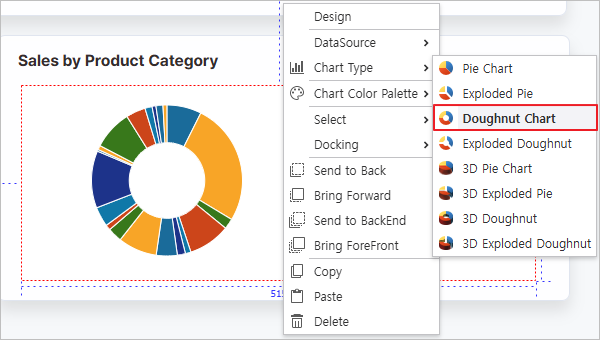
Right-click the Pie-Chart to launch the Design window and modify visual attributes.
Series Legend - Label Field : [Product Subcategory]
- Value Field : [Revenue Amount]
- Format : {0:N0}
- Position : Middle, Right
- Direction : Vertical
Verify the report is functioning correctly.

Step 4. Configure Process Bot
Orchestrate automated dashboard actions and styling using Process Bot.
4.1 Create Inquiry Button
Configure a button to view the report.
- Create a Button control

- Modify the control attributes.
- Name : BTN_RE
- Text : Refresh
- Style > BoxStyle : BTN1

- Right-click the generated button and select Refresh from the Operation Settings menu.

- Click the Module Parameter icon (
 ) to configure the Refresh action.
Refresh Target : PieChart, OlapGrid1, OlapGrid2, OlapGrid3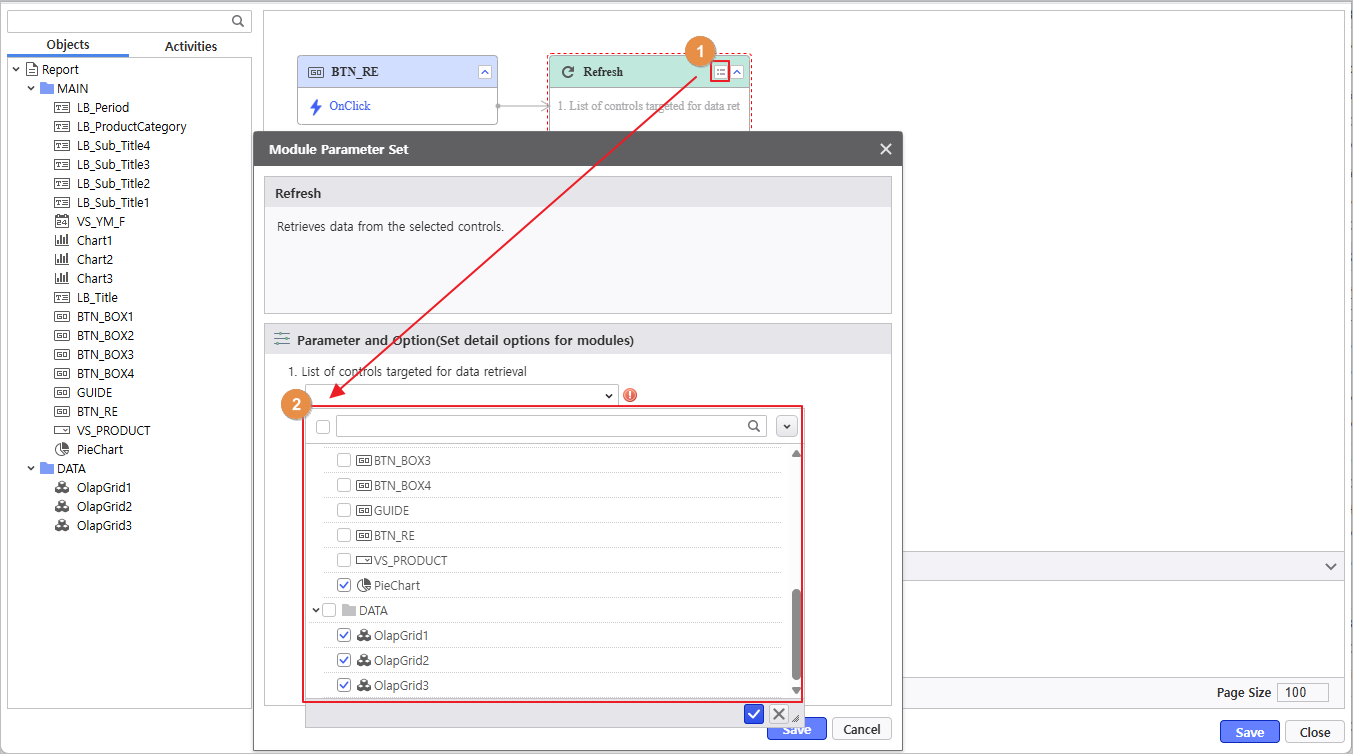
4.2 Set Chart Colors
Set the chart colors using a module.
- Click the Process Bot icon (
 ) to launch the window and double-click the Report object.
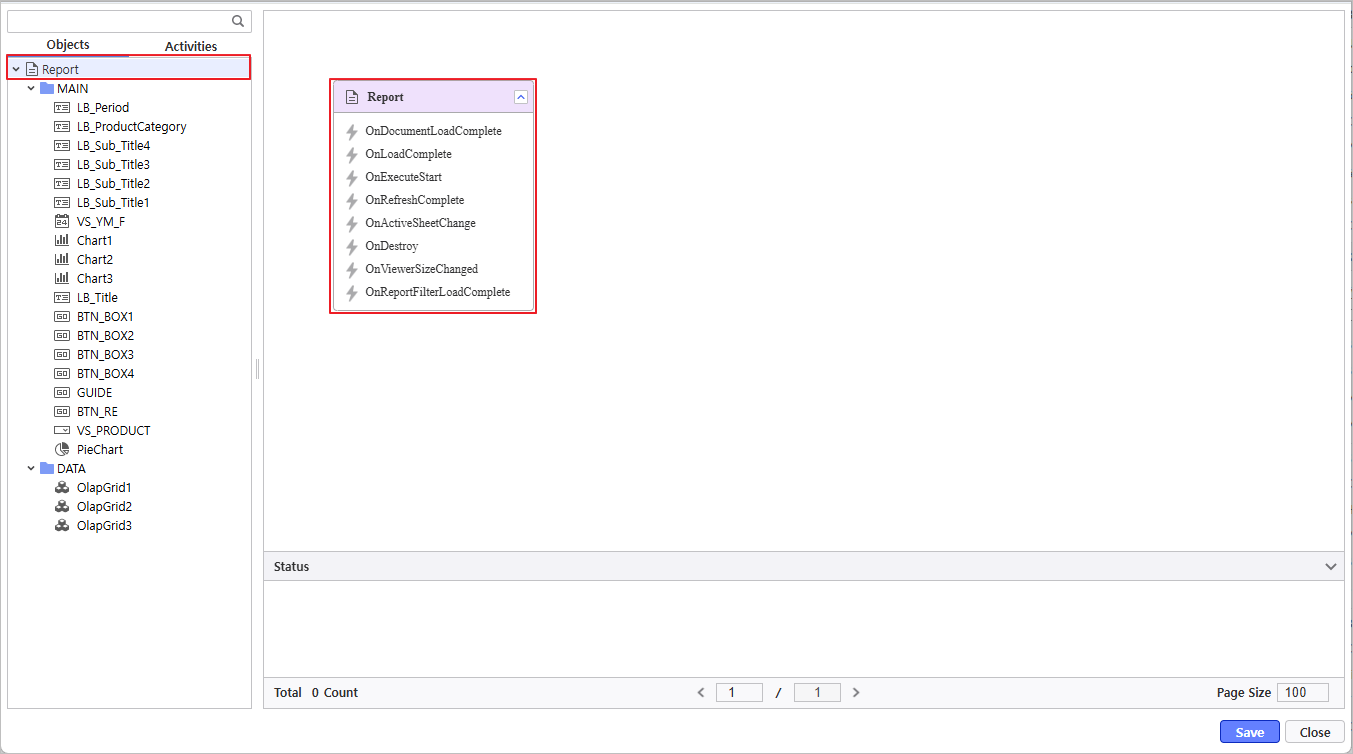
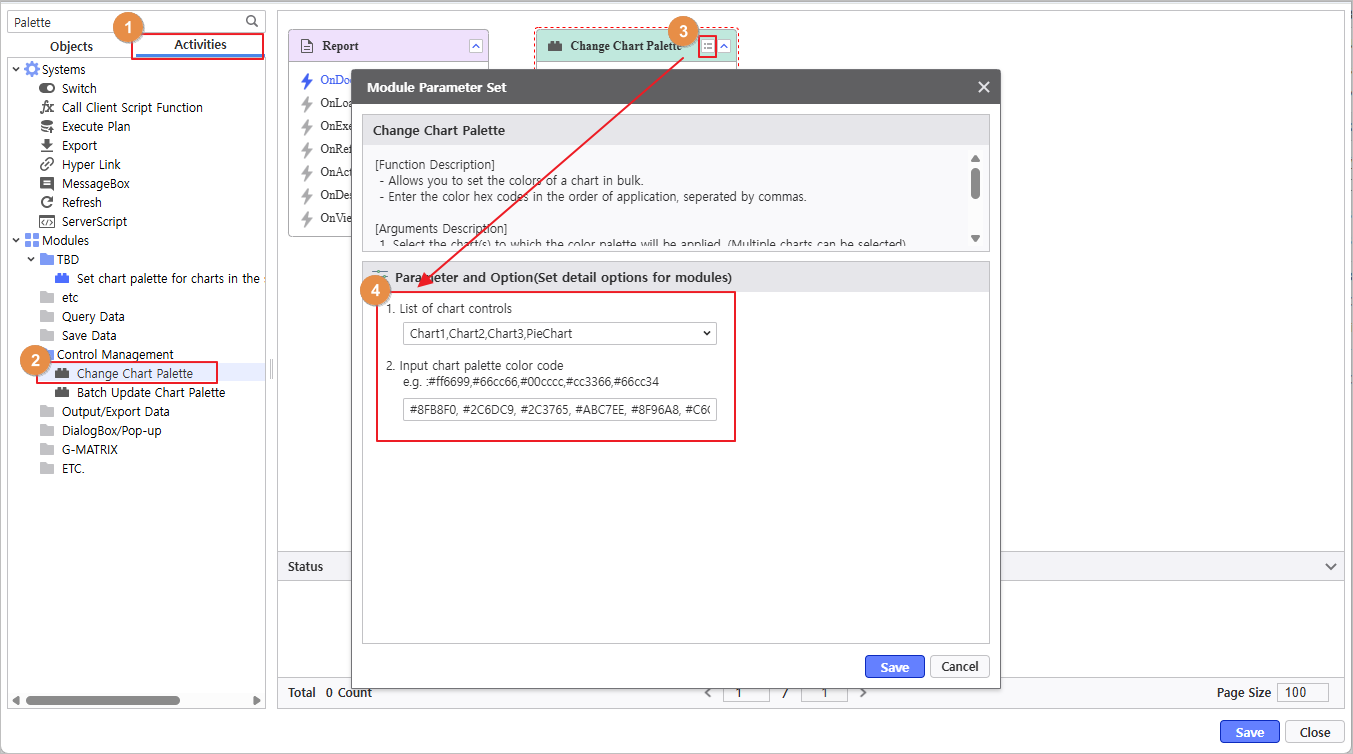
- Navigate to Activities > Modules > Control Management > Change Chart Palette to select the module and set values.
- Chart Selection : PieChart, Chart1, Chart2, Chart3
- Enter Color Values
Once the parameter configuration is complete, link the 'Change Chart Palette' module to the OnDocumentLoadComplete event of the Report.
Verify the report is functioning correctly.
