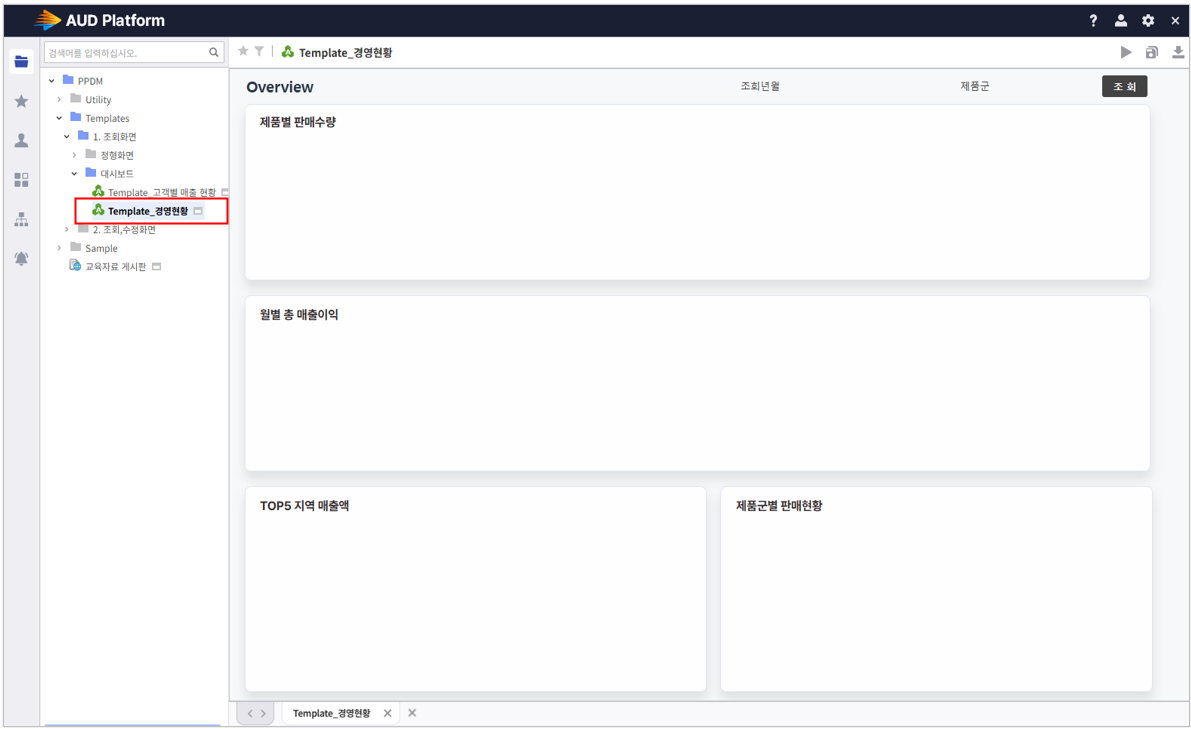
| Easy Heading Macro | ||||||||
|---|---|---|---|---|---|---|---|---|
|
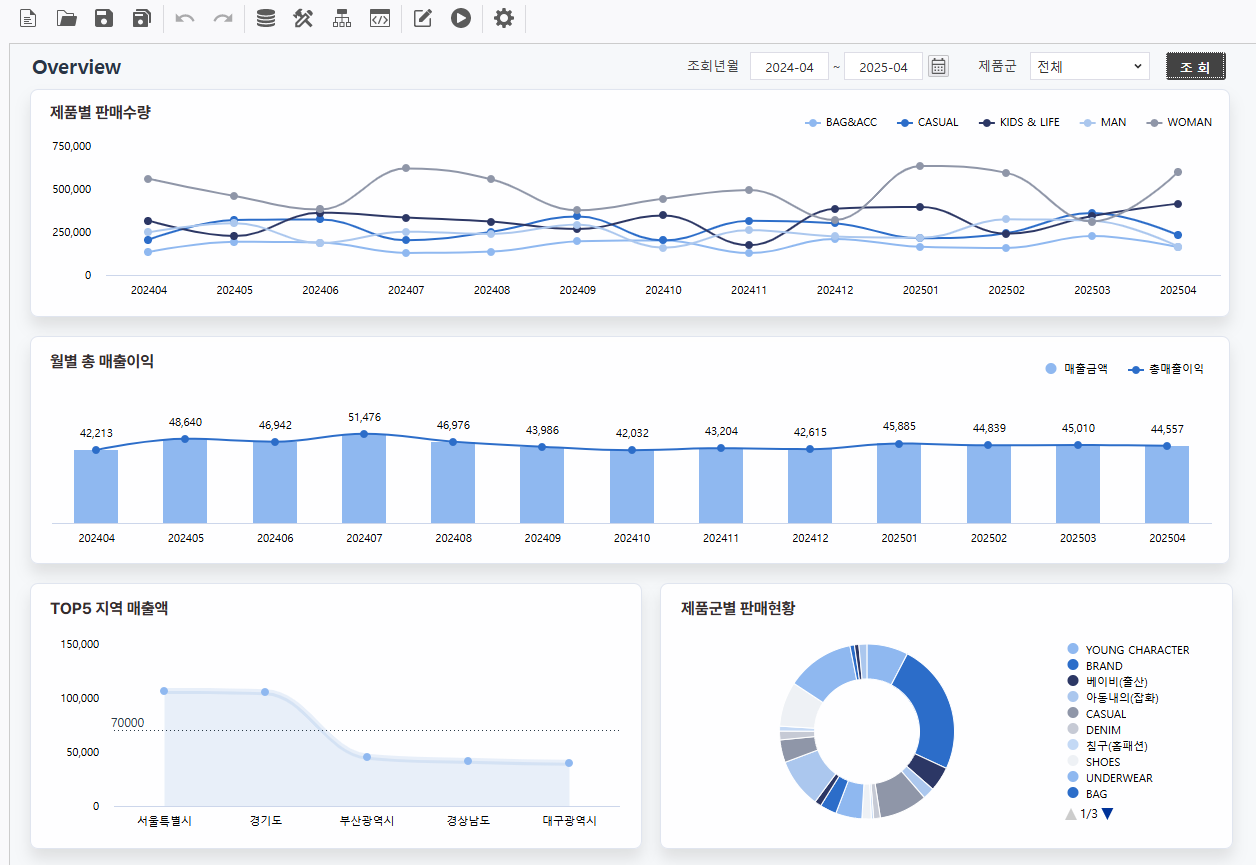
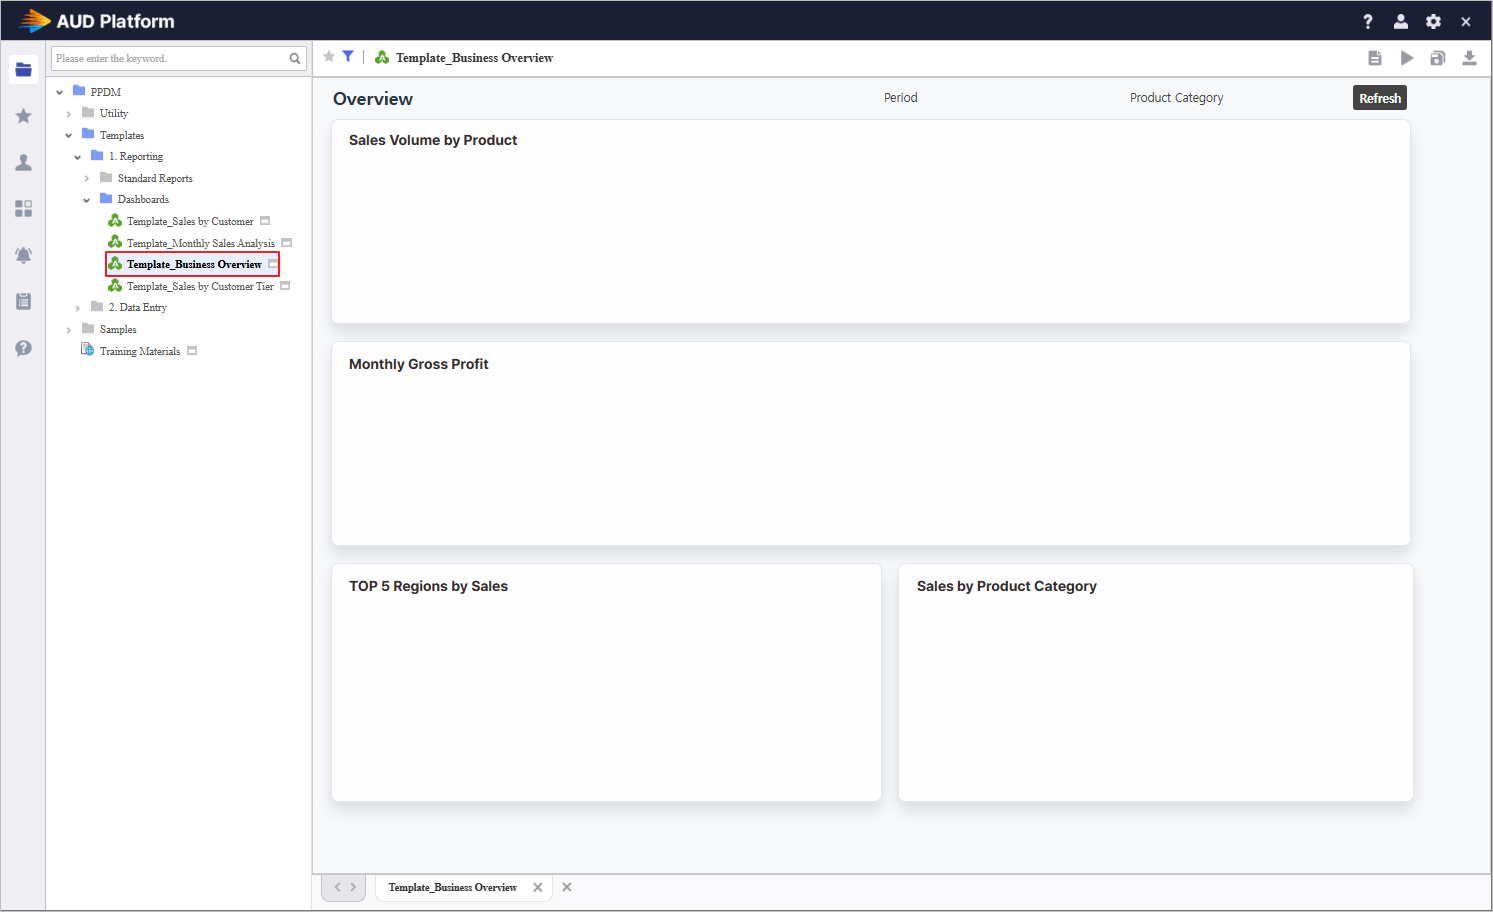
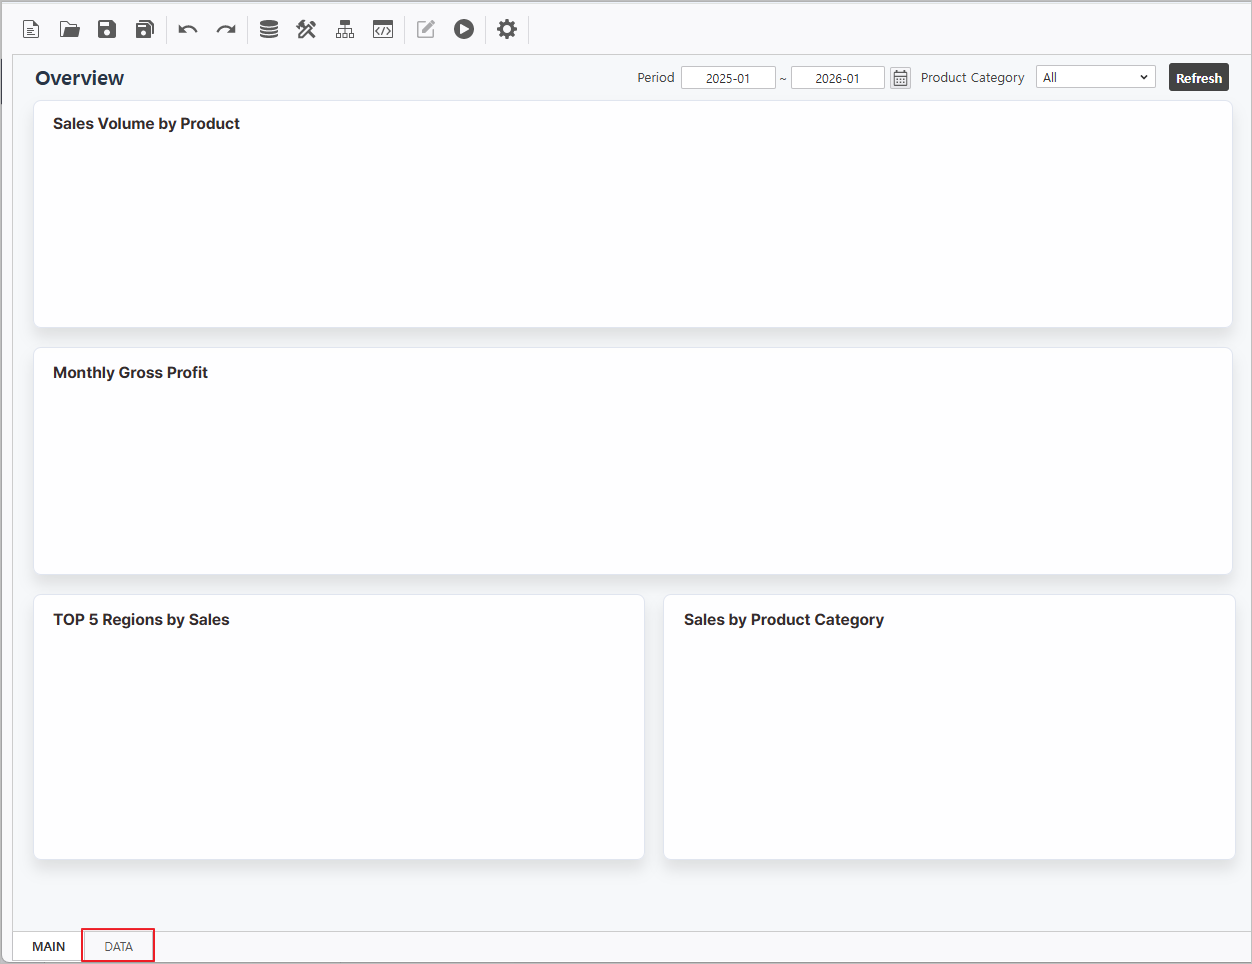
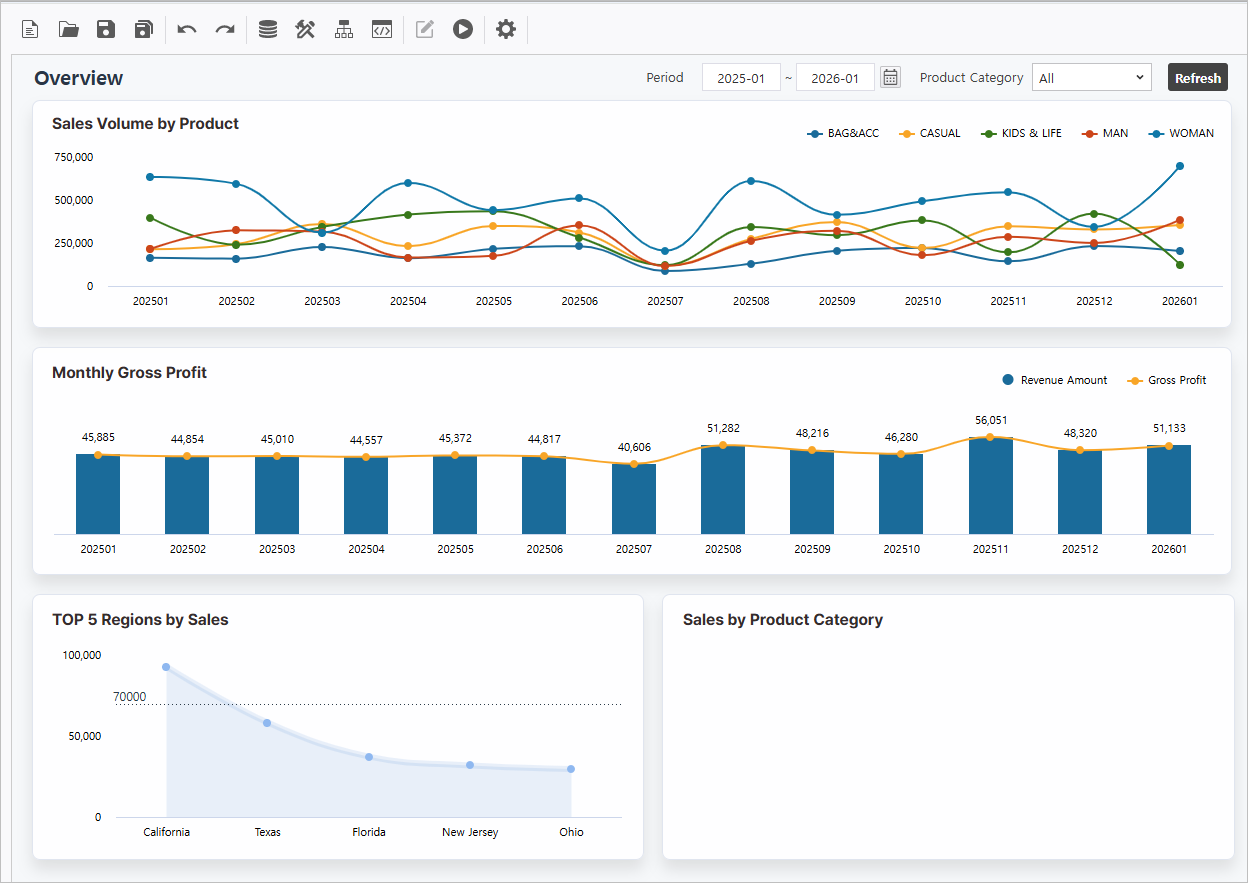
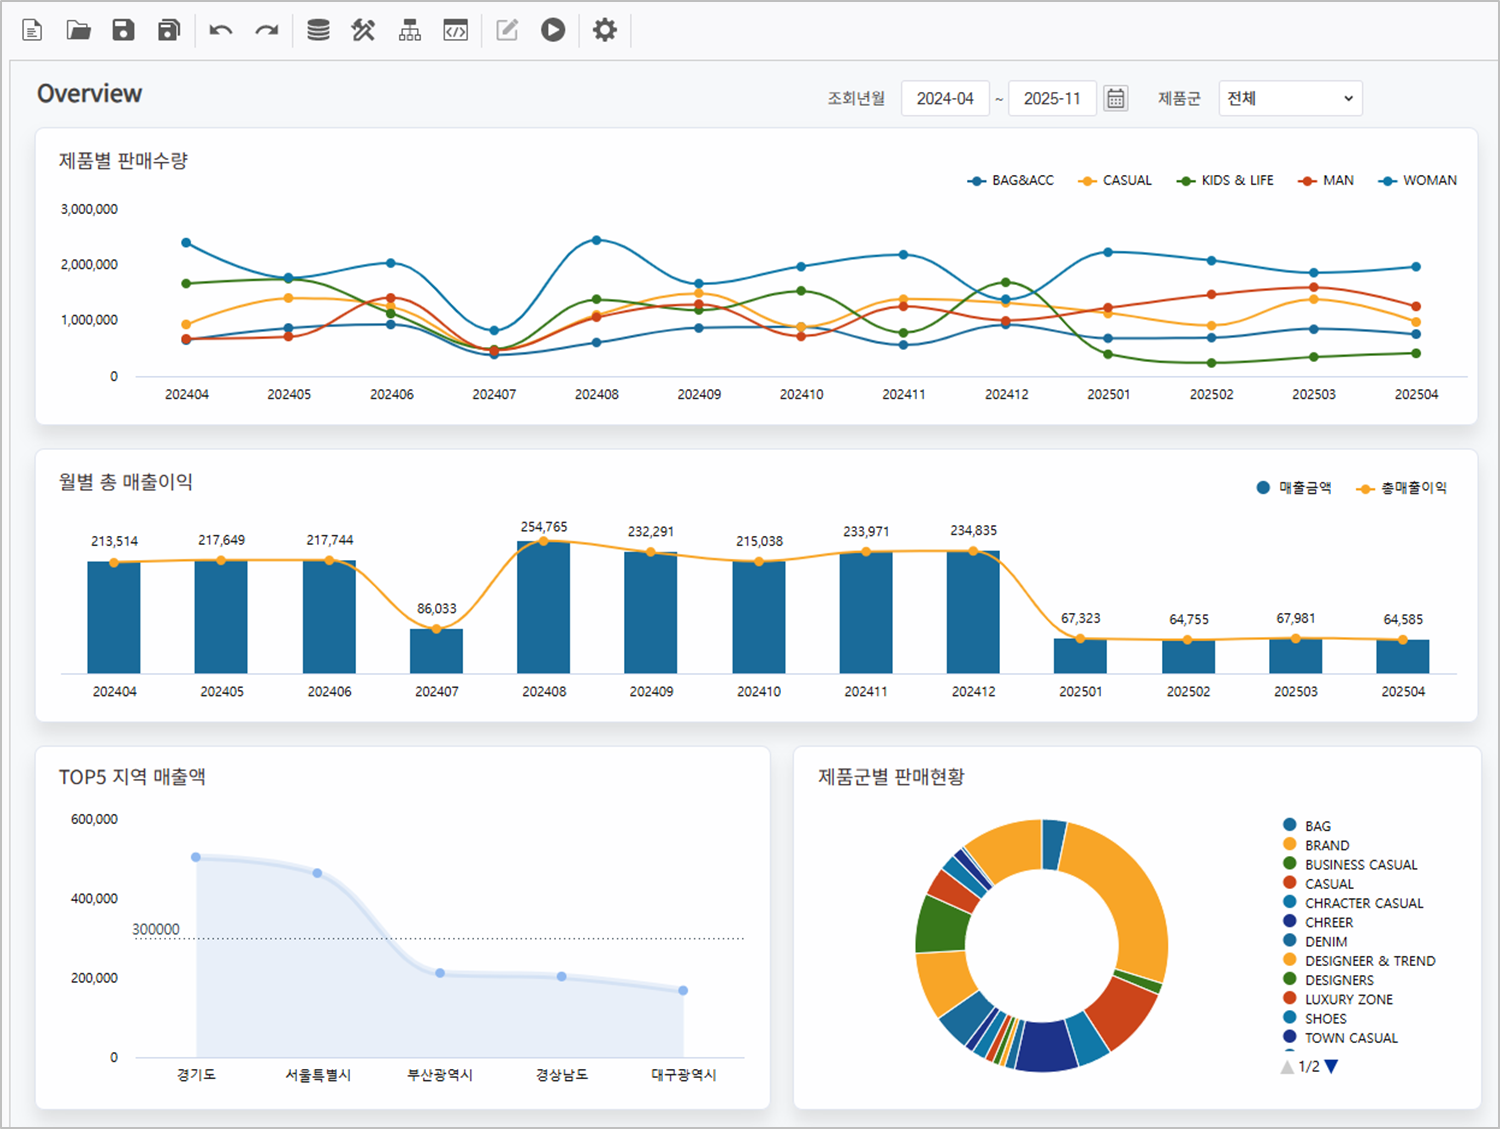
목표화면Target Screen | |||||
|---|---|---|---|---|---|
| |||||
|
Step 1.
...
Establish Inquiry Controls
Define the foundational inquiry components to drive dynamic data filtering.
1.1
...
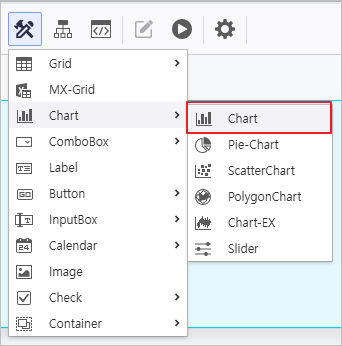
Instantiate Components
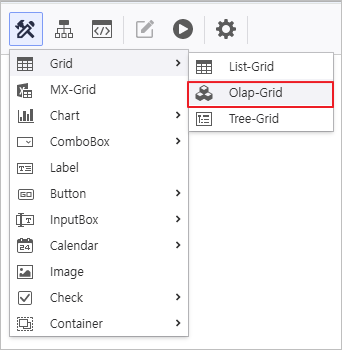
- Access the [UI Bot] 을 클릭하여 menu to generate ComboBox, Calendar, Label 컨트롤을 생성
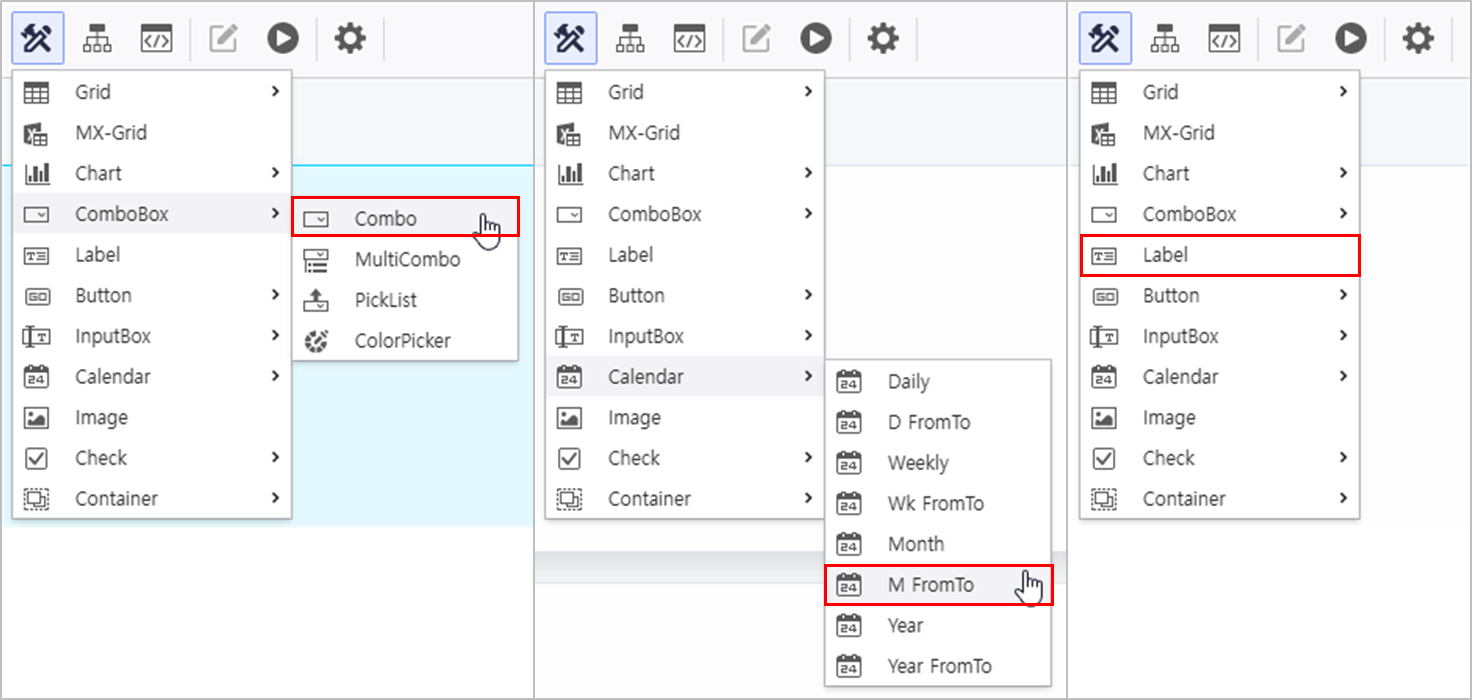 and Label controls on the Designer.
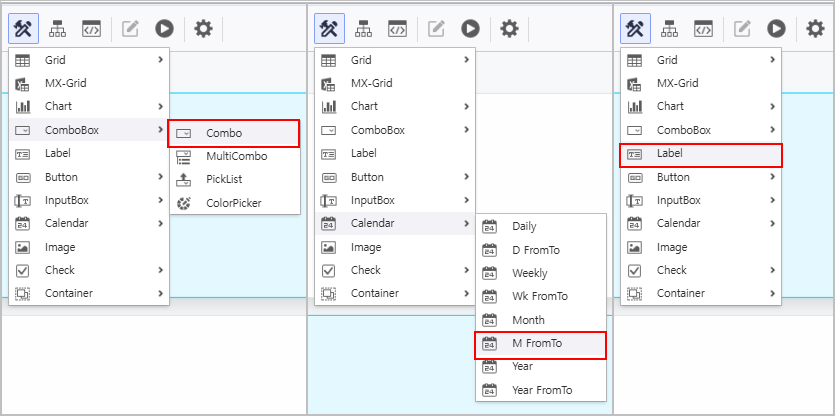
1.2
...
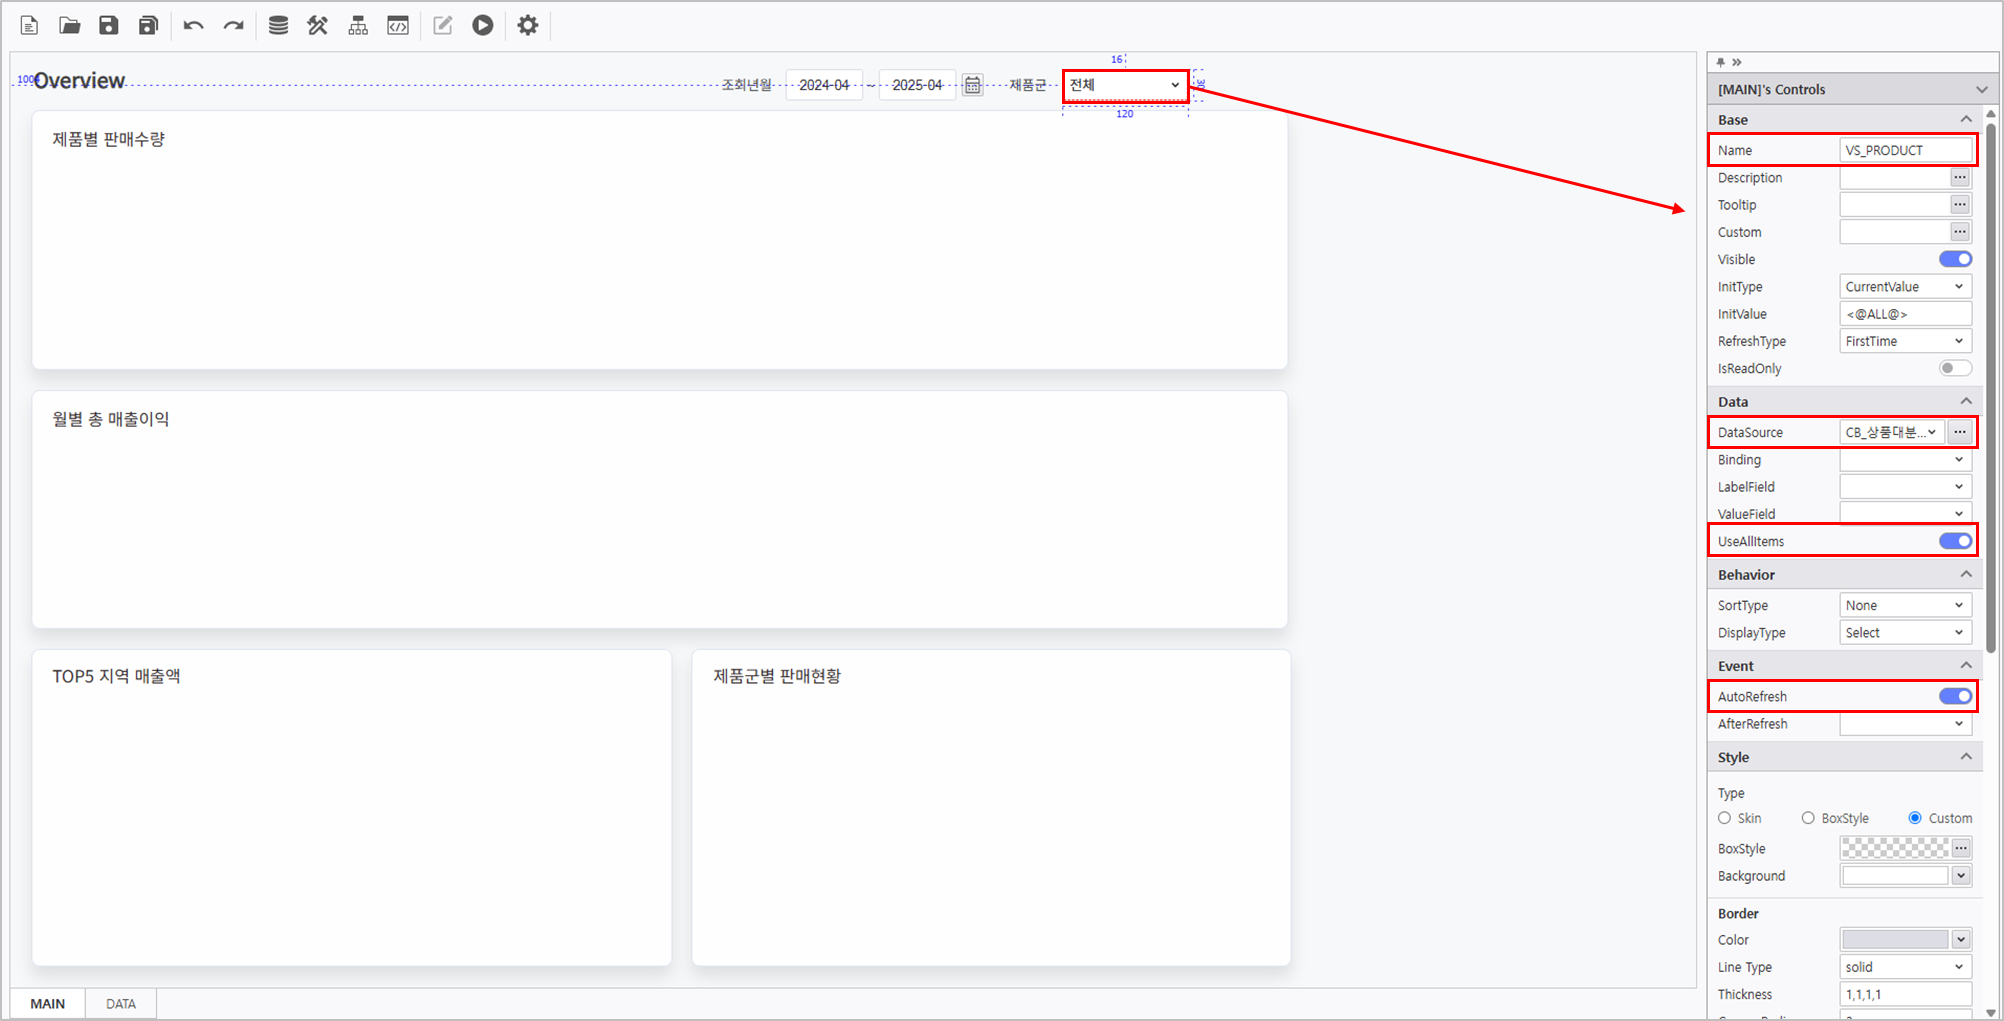
Attribute Configuration
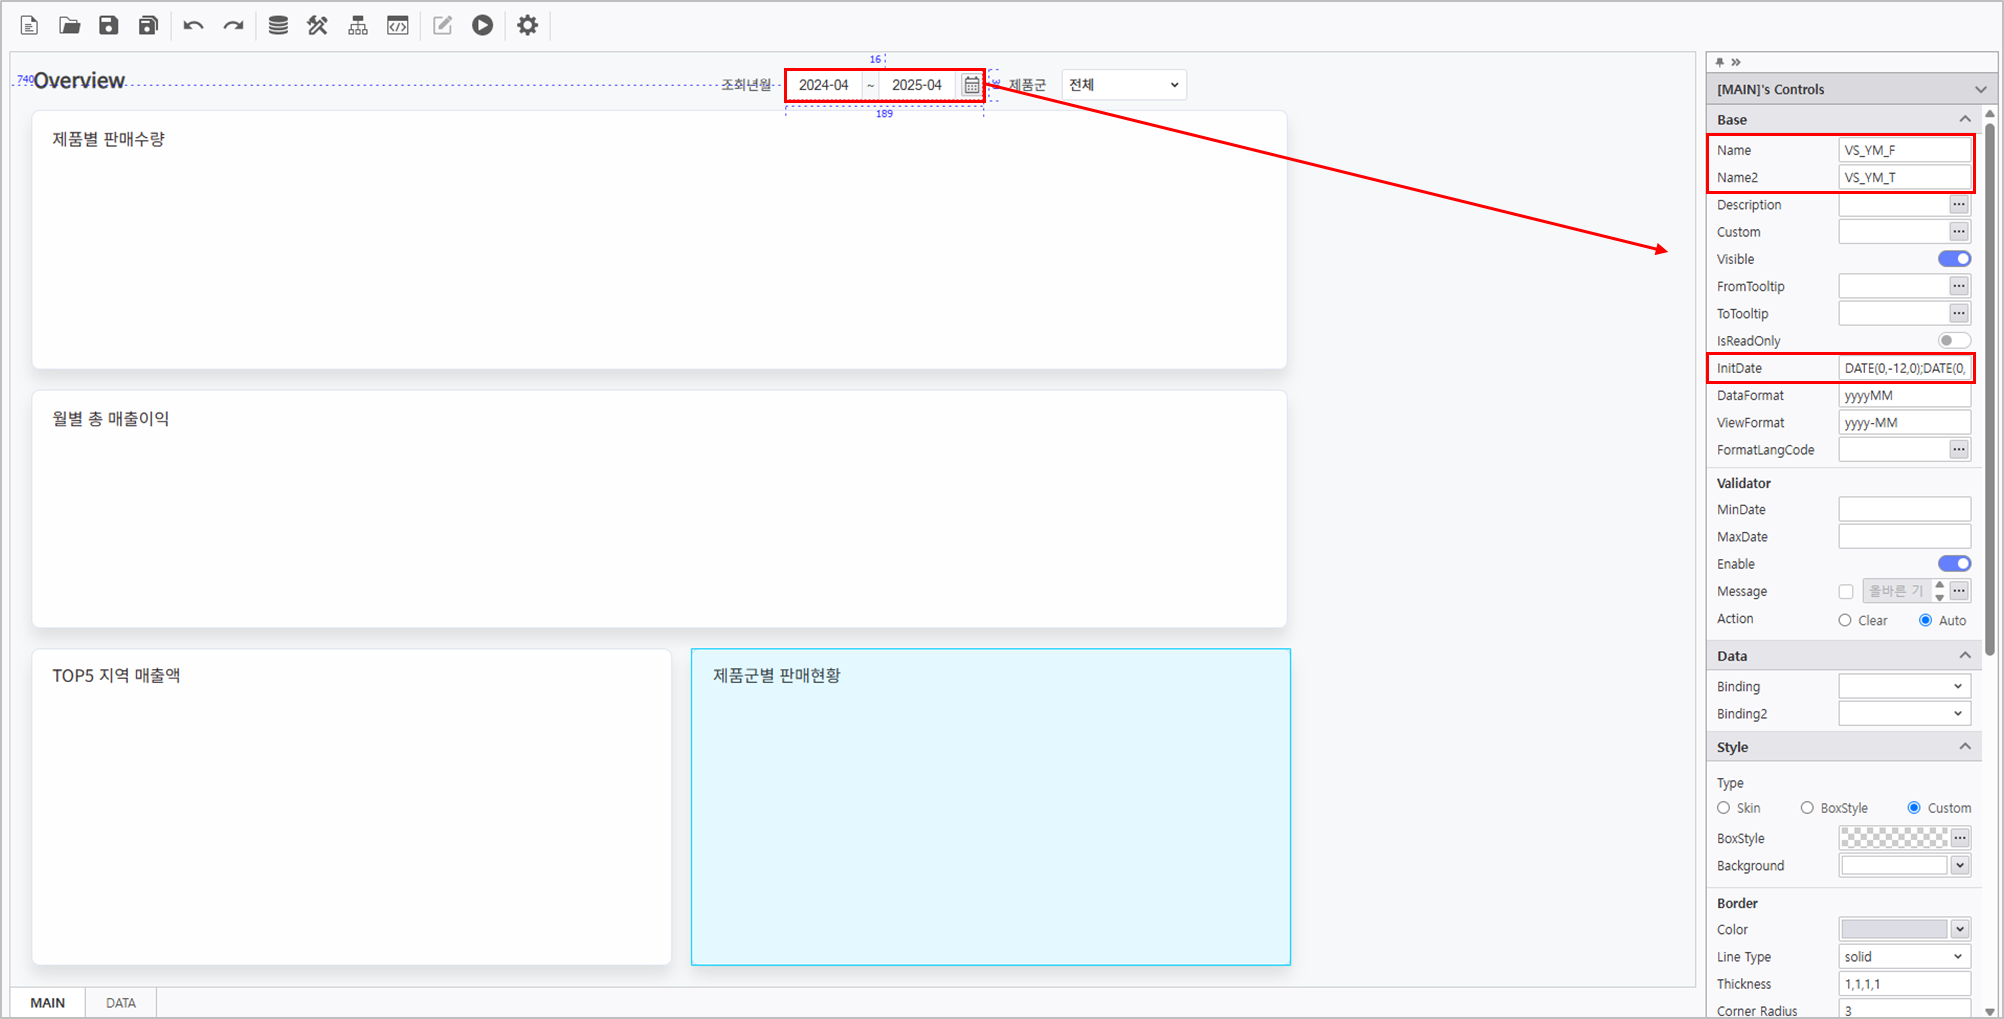
- In the Property Editor on the right, configure the Calendar attributes as follows:
- Name : VS_YM_F
- Name2 : VS_YM_T
- InitValue : DATE(0,-12,0);DATE(0,0,0)
우측의 컨트롤 속성 편집 영역에서 다음이 ComboBox의 속성을 설정합니다.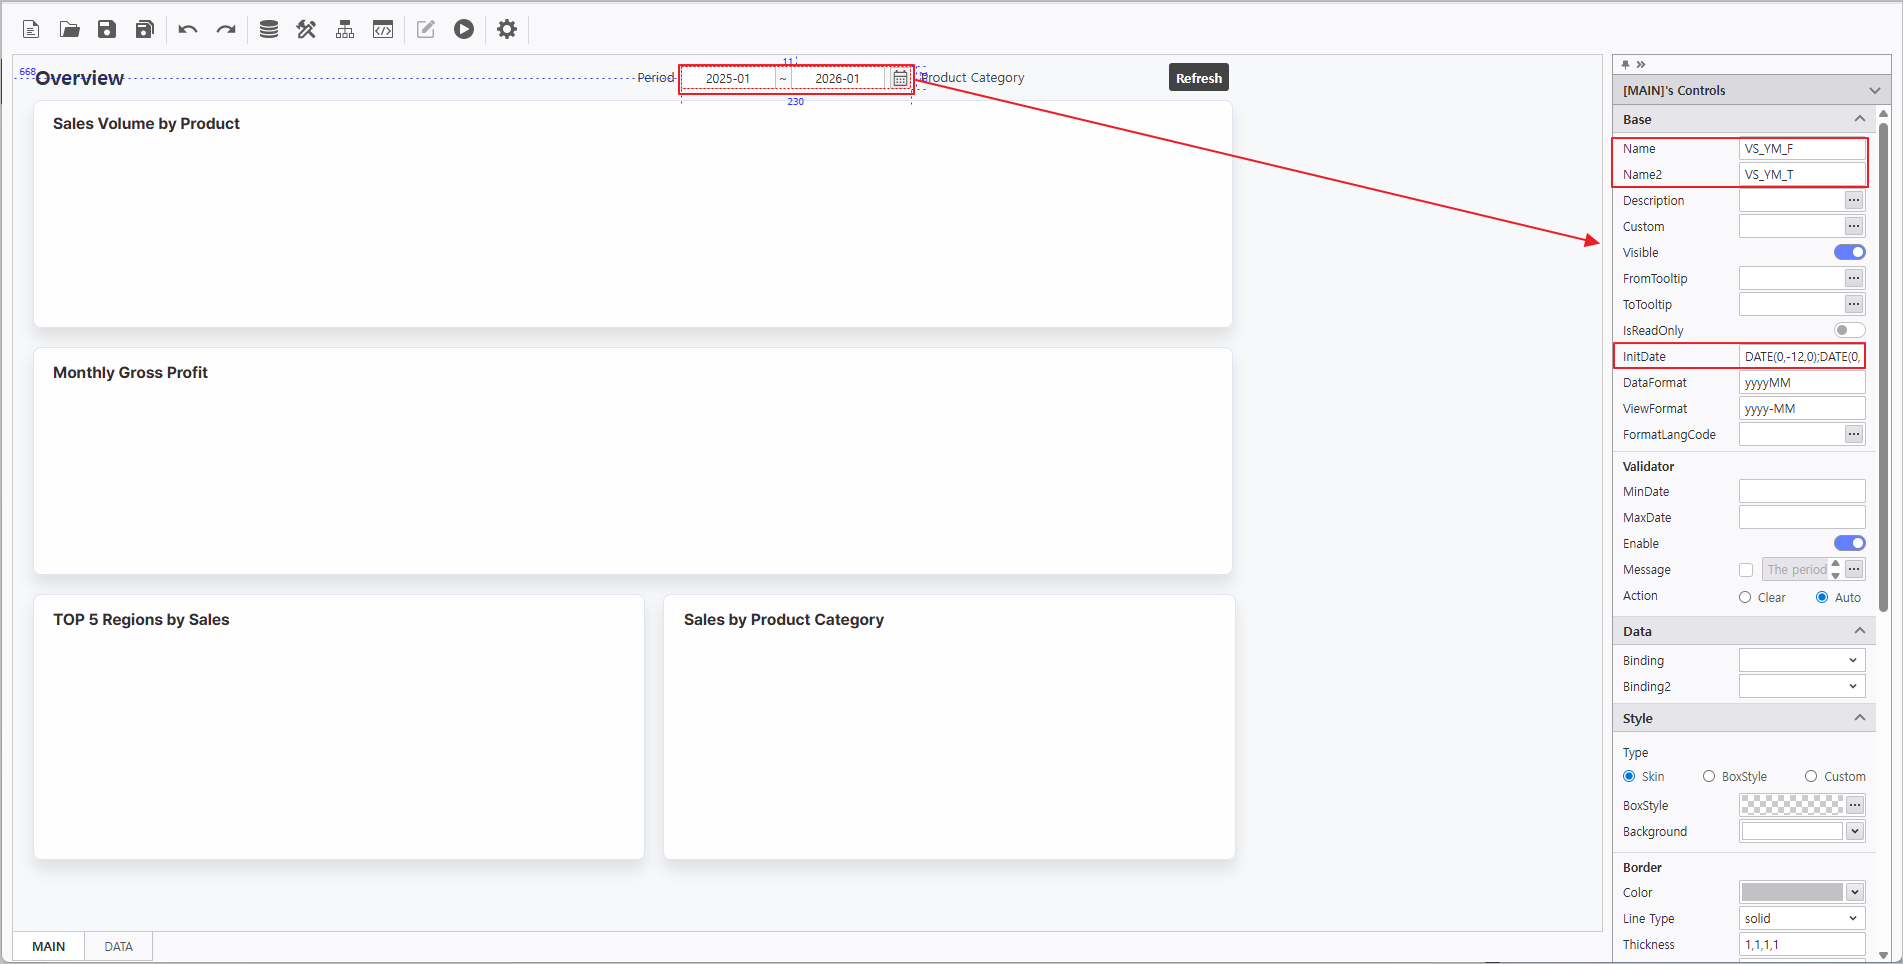
- In the Property Editor on the right, configure the ComboBox attributes as follows:
- Name : VS_PRODUCT
- DataSource : CB_상품대분류ProductCategory
 더보기 More > SQL > "CB_상품대분류ProductCategory"
 - Enable UseAllItems 활성화
- Enable AutoRefresh 활성화
우측의 컨트롤 속성 편집 영역에서 Label의 속성을 설정합니다.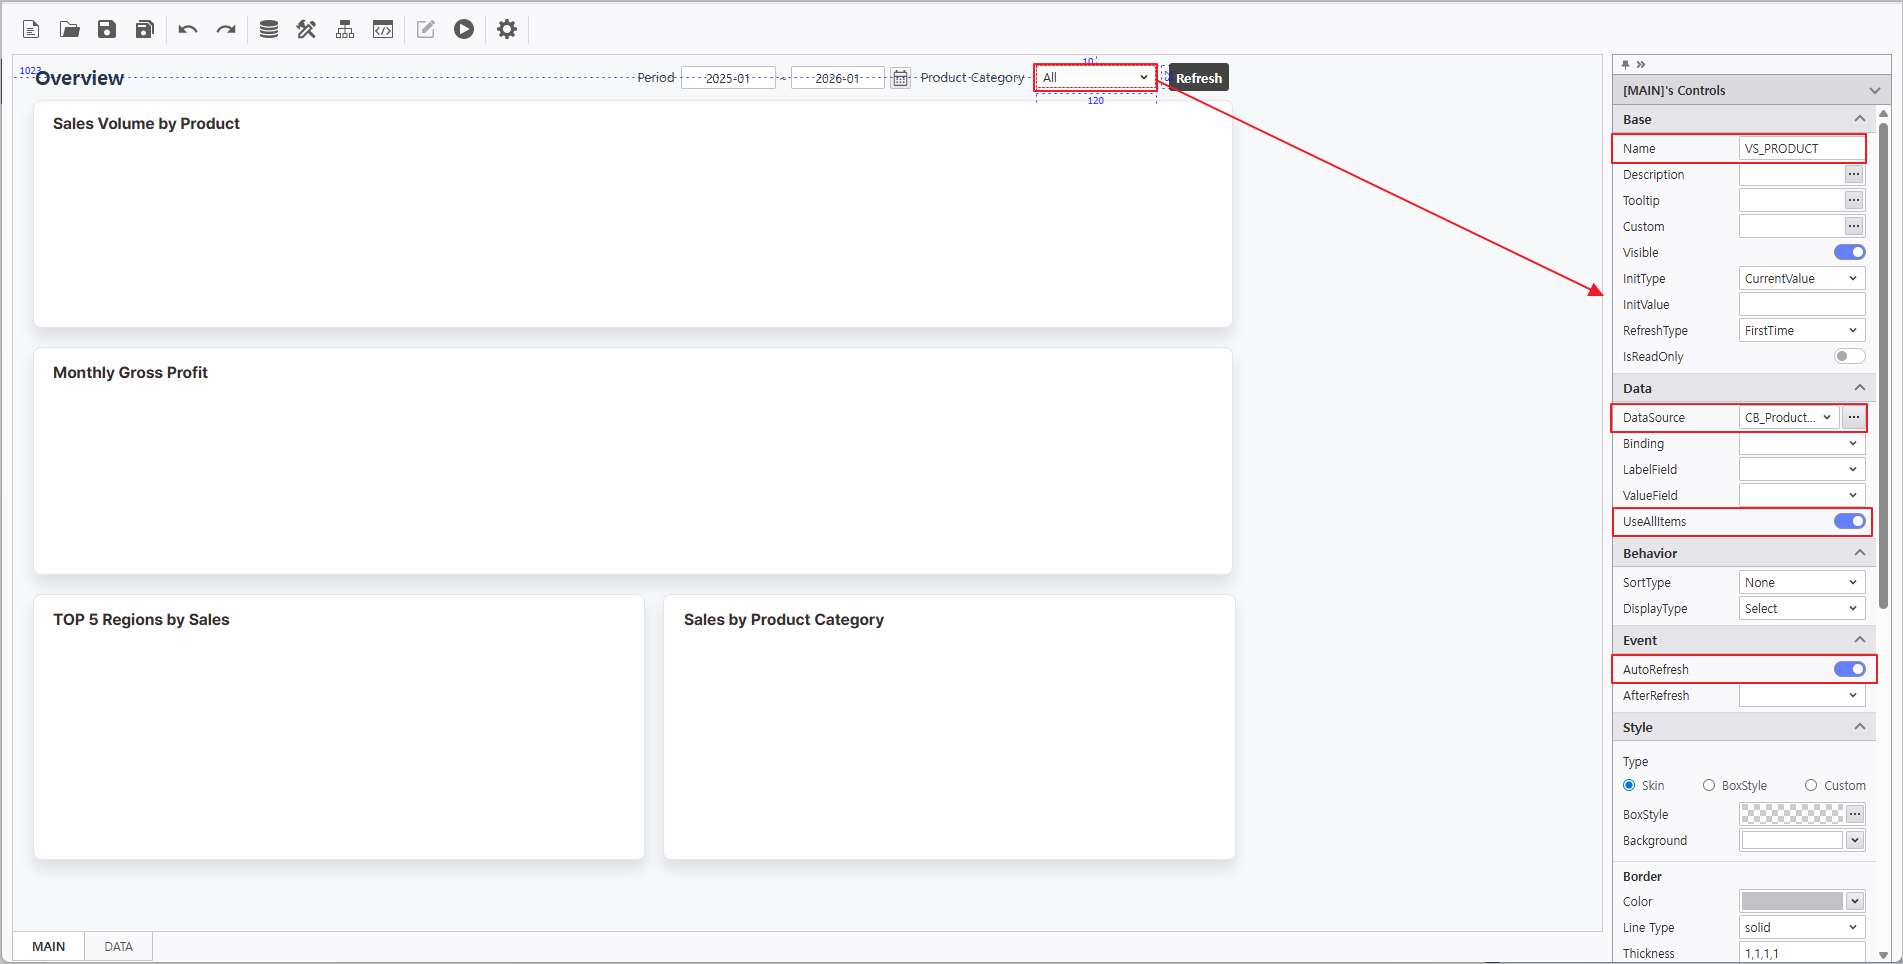
In the Property Editor on the right, configure the Label attributes:
Name Text LB_조회년월Period조회년월 Period LB_제품군ProductCategory제품군 Product Category
Step 2.
...
Synchronize Chart and OlapGrid
...
Leverage chart attributes to link data from the OlapGrid.
2.1 OlapGrid
...
Configuration
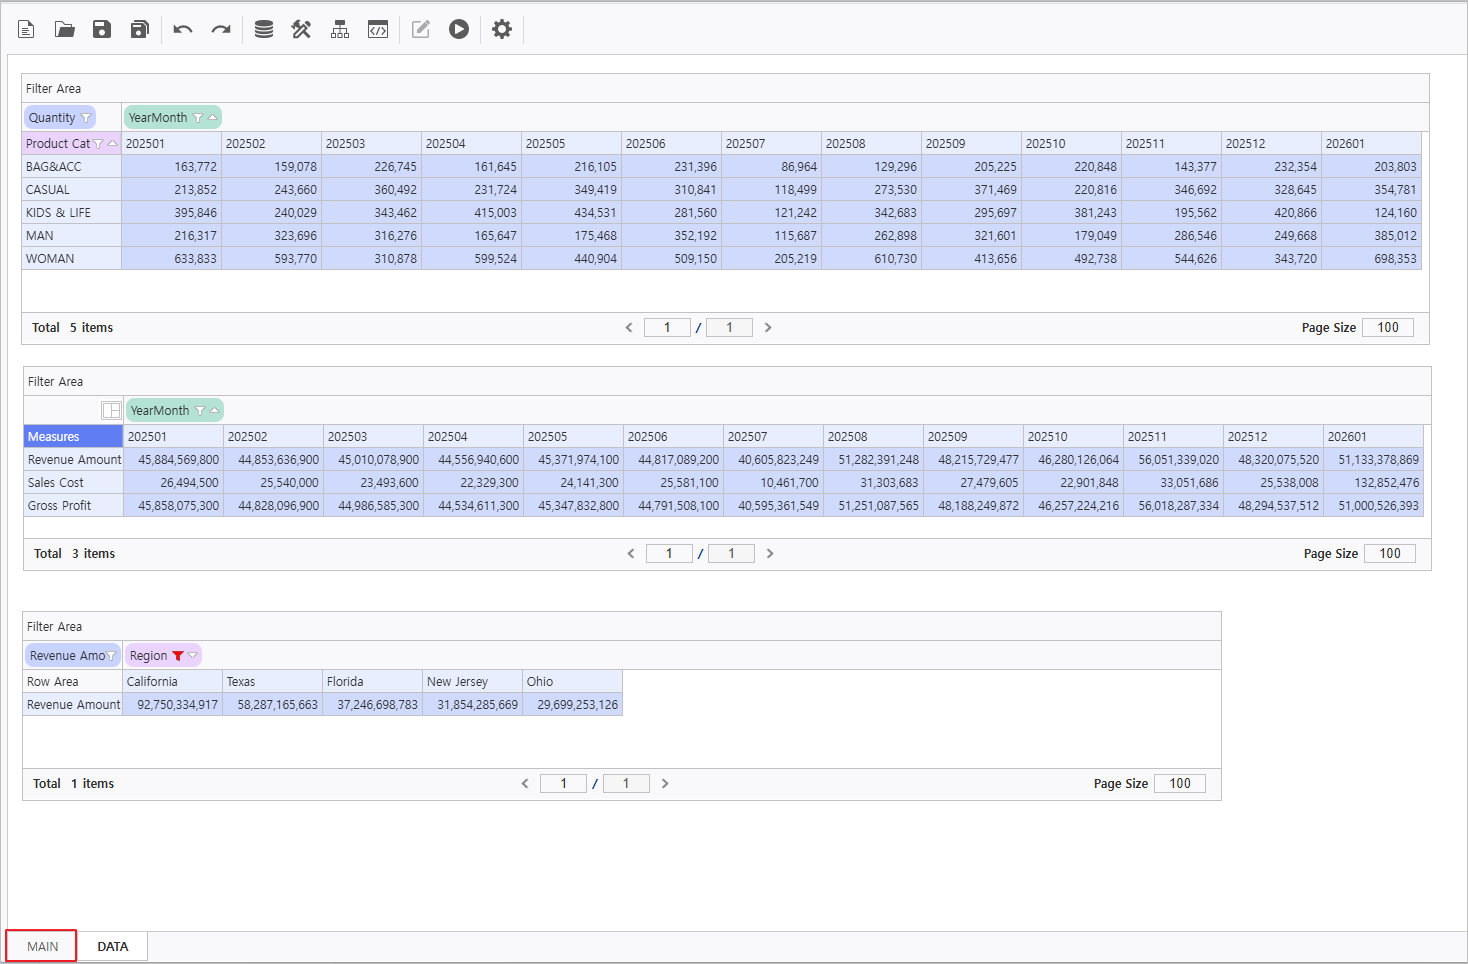
- Navigate to the DATA Form at the bottom of the report.
- Create an OlapGrid control.
Connect Data Source to OlapGrid & Enable AutoRefresh.
정보 title OlapGrid 데이터소스 연결 DataSource Connection Right-click OlapGrid > DataSource > i-META 메뉴를 선택해 매출분석 META 파일 선택 ▪ 매출분석 경로 : 공용폴더 > Select Sales Analysis META file
▪ Sales Analysis Path : Public Folder > PPDM > Sample Samples > 3. i-META > "매출분석"Sales Analysis
정보 title Enable AutoRefresh 활성화 각 OlapGrid를 선택해서 나타나는 우측 속성 창에서 AutoRefresh를 활성화합니다.
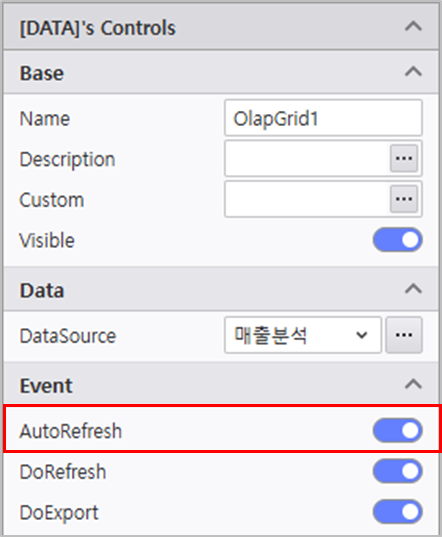
Name 조회 항목 조회 조건 연산자 변수명Select each OlapGrid and activate AutoRefresh in the properties pane on the right.
Name Query Items Query Conditions Operator Variable Names OlapGrid1 - Column : [년월YearMonth]
- Row : [상품대분류Product Category]
- Data : [매출수량Quantity]
[년월YearMonth] BETWEEN :VS_YM_F ~ :VS_YM_T [상품대분류Product Category] = @:VS_PRODUCT OlapGrid2 - Column : [년월YearMonth]
- Data : [매출금액Revenue Amount, 매출원가Sales Cost]
[년월YearMonth] BETWEEN :VS_YM_F ~ :VS_YM_T [상품대분류Product Category] = @:VS_PRODUCT OlapGrid3 - Column : [매장지역Region]
- Data : [매출금액Revenue Amount]
[년월YearMonth] BETWEEN :VS_YM_F ~ :VS_YM_T OlapGrid 컨트롤을 우 클릭하여 디자인 메뉴를 실행한 후 디자인 속성을 변경합니다.
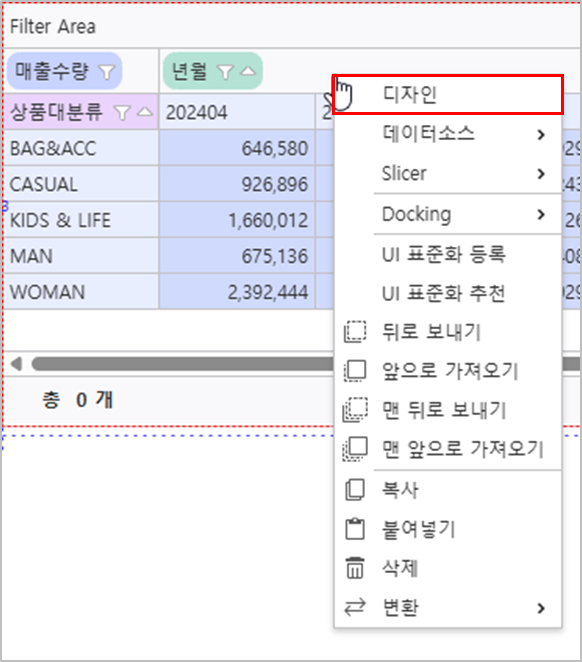 Right-click the OlapGrid to launch the Design menu and modify design attributes.
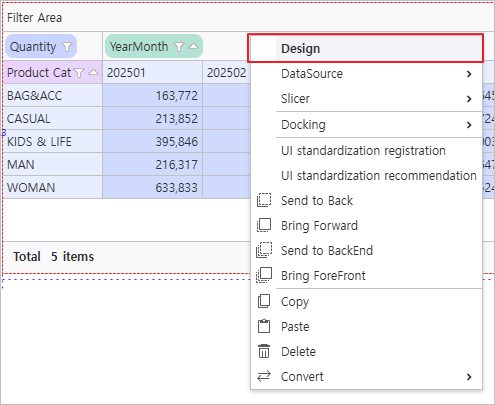
Name 필드Field 필드 > 계산 필드 추가 설정 > 자동 선택 영역Field > Calculated Field Option > Auto Selection Area
OlapGrid1 - - - 자동 선택 영역 활성화 범위 : 오른쪽 12, 아래쪽
- Enable Auto Selection Area
- Range : Right 12, Bottom 4
OlapGrid2 - Change [Measures] 필드 위치 변경Field Position :
Column > Row
- 캡션Caption : 총매출이익Gross Profit
- 서식 Format : {0:N0}
- 수식Formula : [매출금액Revenue Amount] - [매출원가Sales Cost]
- 자동 선택 영역 활성화
- 범위 : 오른쪽 12, 아래쪽 Enable Auto Selection Area
- Range : Right 12, Bottom 2
OlapGrid3 - Change [매장지역] 필드 속성 변경Region] Field Attribute : 정렬
 클릭
클릭
Click More at Sort Attribute
- - 자동 선택 영역 활성화
- 범위Enable Auto Selection Area
- Range : 오른쪽 Right 4
정보 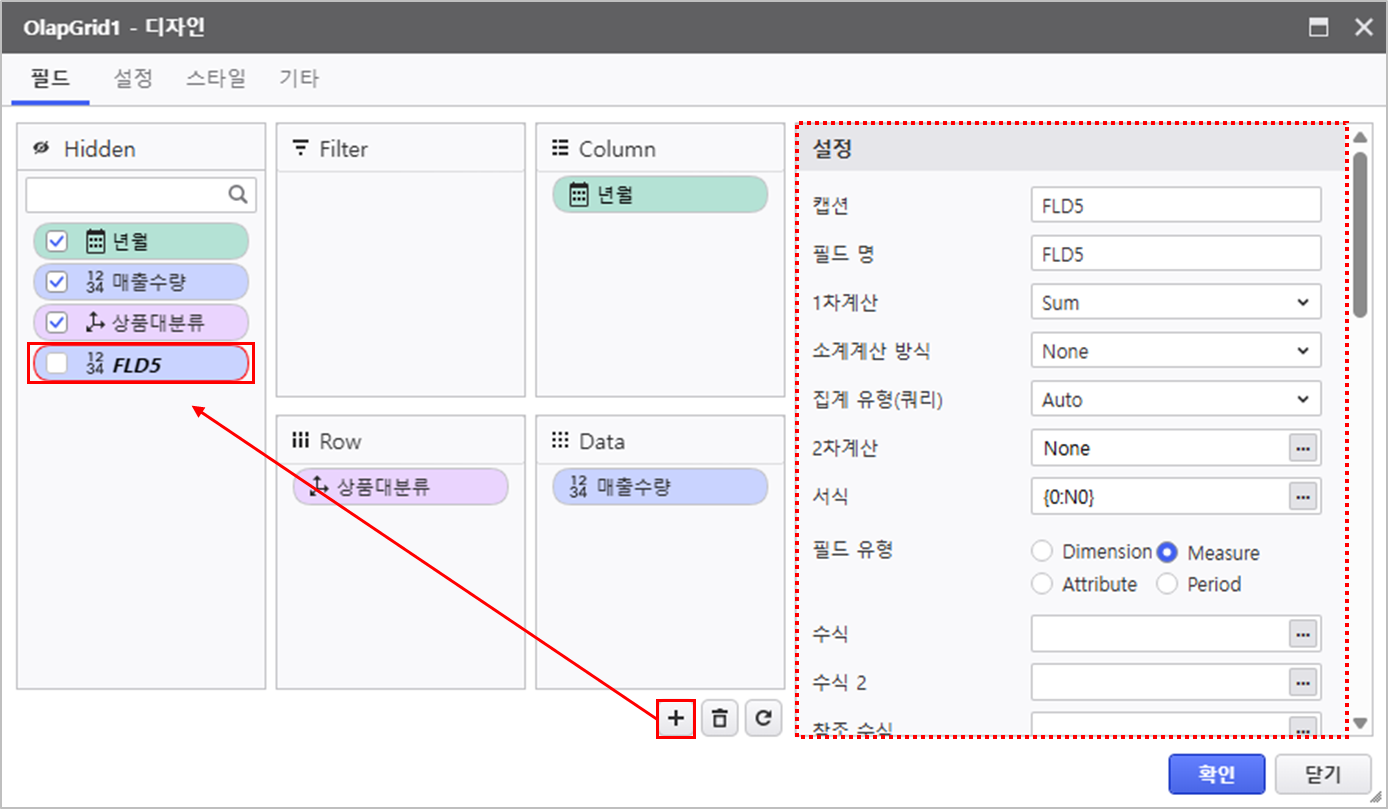
title 계산필드 추가 디자인 메뉴 > 필드에서
 신규 아이콘을 클릭하여 계산 필드를 생성할 수 있습니다.
Add Calculated Field Navigate to Design > Field and click the Add
icon to generate calculated fields.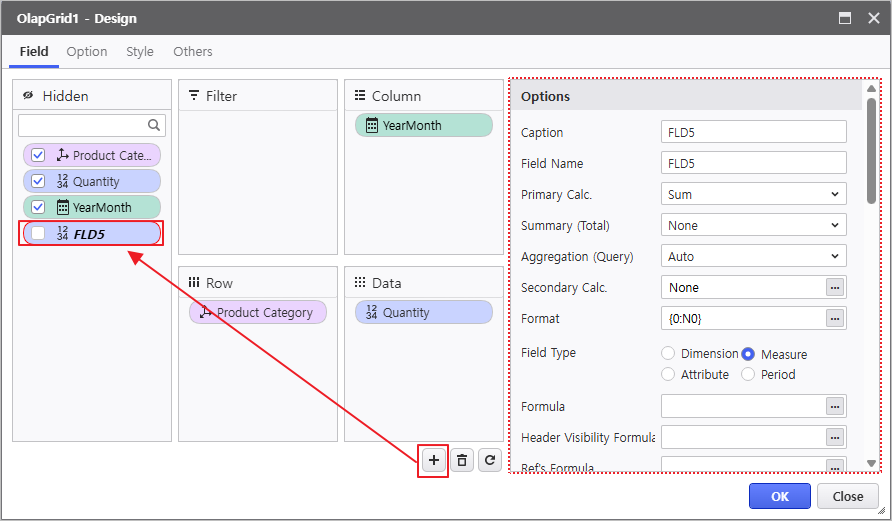
2.2 Chart
...
Configuration
- Navigate to the MAIN Form at the bottom of the report.
- Instantiate Chart controls within the MAIN Form.
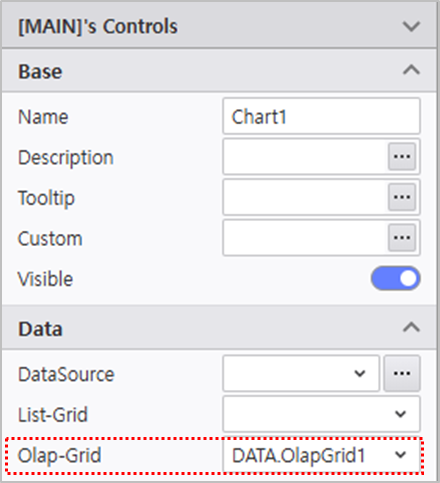
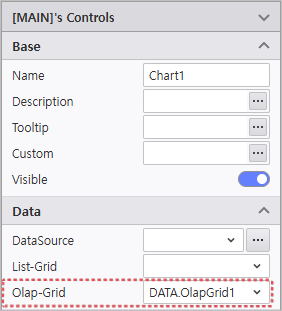
Select each Chart control to update its Name in the property menu and link it to the OlapGrid created in the DATA form.
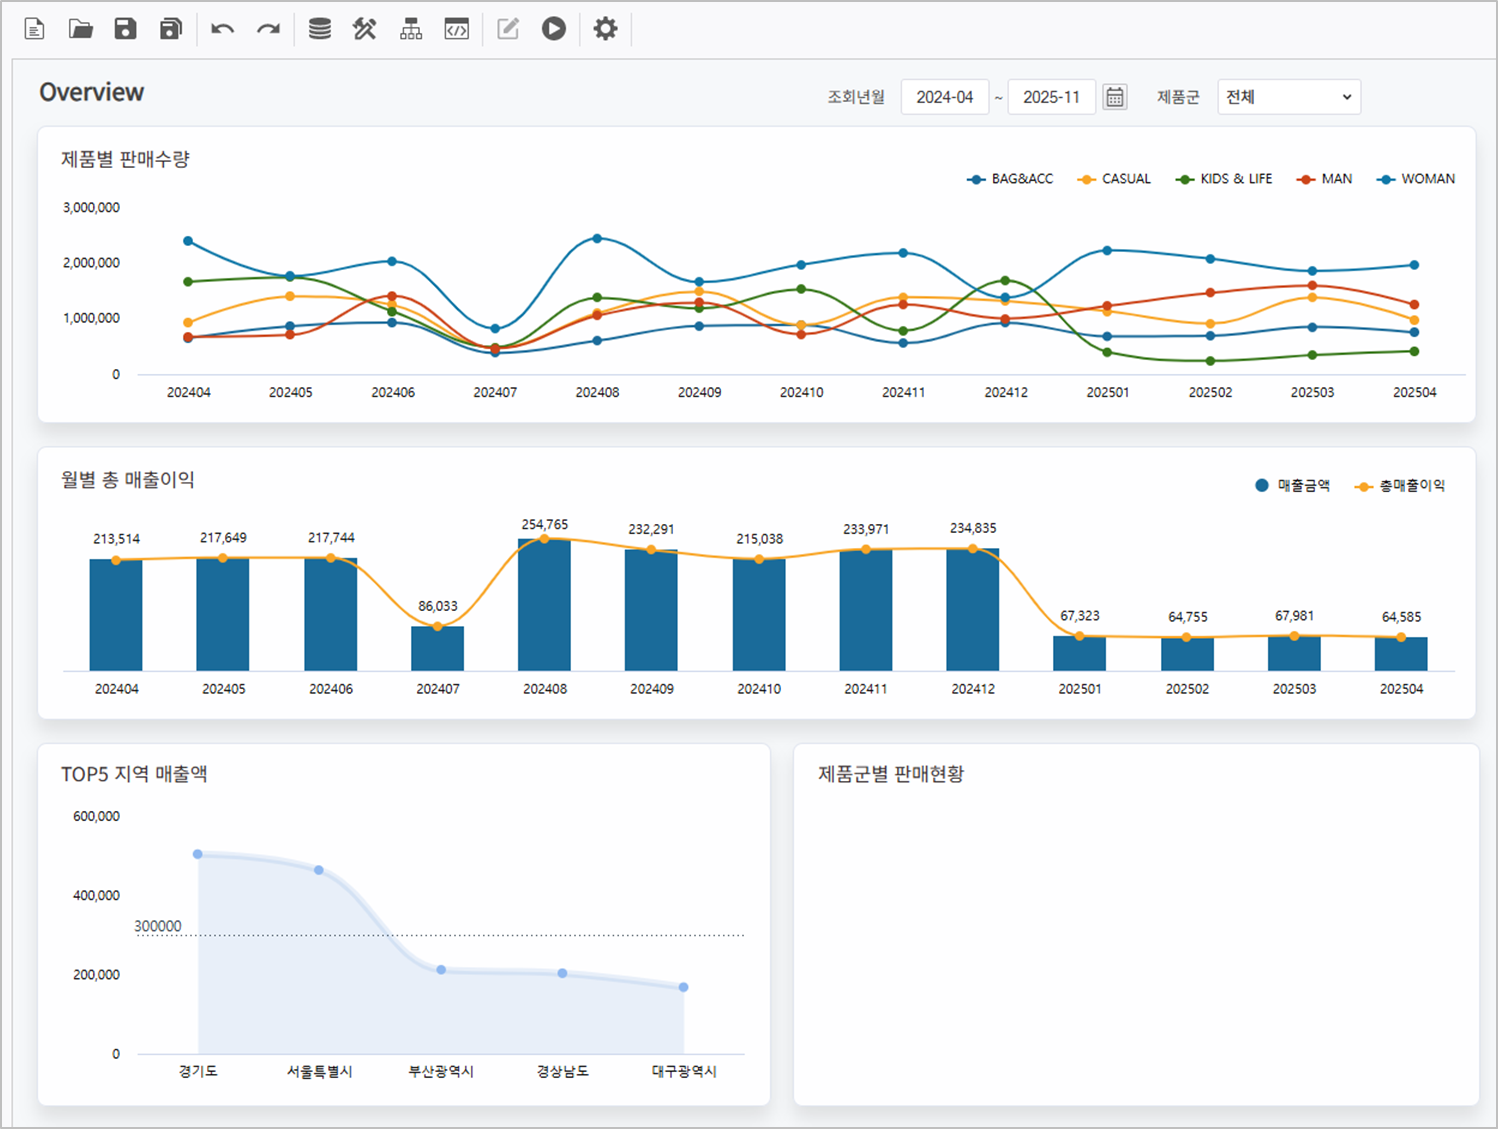
Name Data > OlapGrid Chart1 DATA.OlapGrid1 Chart2 DATA.OlapGrid2 Chart3 DATA.OlapGrid3 Chart1 제품별 판매 수량 곡선형정보 title OlapGrid 바인딩Binding 각 Chart를 클릭해서 나타나는 우측 속성 창에서 연결하고자 하는 Grid를 지정할 수 있습니다.
디자인 메뉴를 클릭하여 디자인 속성을 변경합니다.
Name 컨트롤 배치 영역 기본 > 차트 유형 계열 축 범례 Select each Chart and designate the target Grid in the OlapGrid property field.
Click the Design menu to modify visual attributes.
Name Control Area Basic > Chart Type Series Axis Legend Chart1 Sales Volume by Product Spline - - - 위치 Position : Top, Right
- 방향 Direction : Horizontal
Chart2 월별 총 매출이익Monthly Gross Profit - - 매출원가 : 표시 비활성화
- 총매출이익 차트 유형 : 곡선형Sales Cost : Deactivate Visible
- Gross Profit Chart Type : Spline
- - 위치 Position : Top, Right
Chart3 TOP5 지역 매출액 곡선 영역형 스타일 :
배경색상 > 투명도Regions by Sales Area Spline - Style :
Background Color > Transparency > 0.1
심볼 유형 Symbol Type > Circle
심볼 색상 Symbol Color > #8fb8f0 - 기타 Others : 단위 Unit > 1000000(백 만Million)
- PlotLines :
선 색상 Line Color > #2a3a47
선 스타일 Line Style > Dot
선 두께 Line Width > 1
표시 기준값 Display Criteria > 70000(칠 만)
기준값 표시 활성화
Enable Criteria Visible
- Position : Top, Right
보고서가 정상적으로 작동하는지 확인합니다Verify the report is functioning correctly.
Step 3. Create PieChart
...
제품군별 판매현황 정보를 나타낼 도넛 차트를 생성합니다.
...
Develop a Doughnut Chart to visualize the current sales status by product category.
- Create a Pie-Chart control.

- Modify the control attributes
- Name : PieChart
- Enable AutoRefresh 활성화
매출분석 META 파일을 활용해 데이터 소스를 연결합니다.
조회 항목 조회 조건 연산자 변수명 [상품중분류, 매출금액] [년월 Bind the data source using the Sales Analysis META file.
Query Items Query Conditions Operator Variable Names [Product Subcategory, Revenue Amount] [YearMonth] BETWEEN :VS_YM_F ~ :VS_YM_T [상품대분류Product Category] = @:VS_PRODUCT - 차트 유형 변경
차트 유형Change Chart Type- Chart Type : 도넛형Doughnut Chart
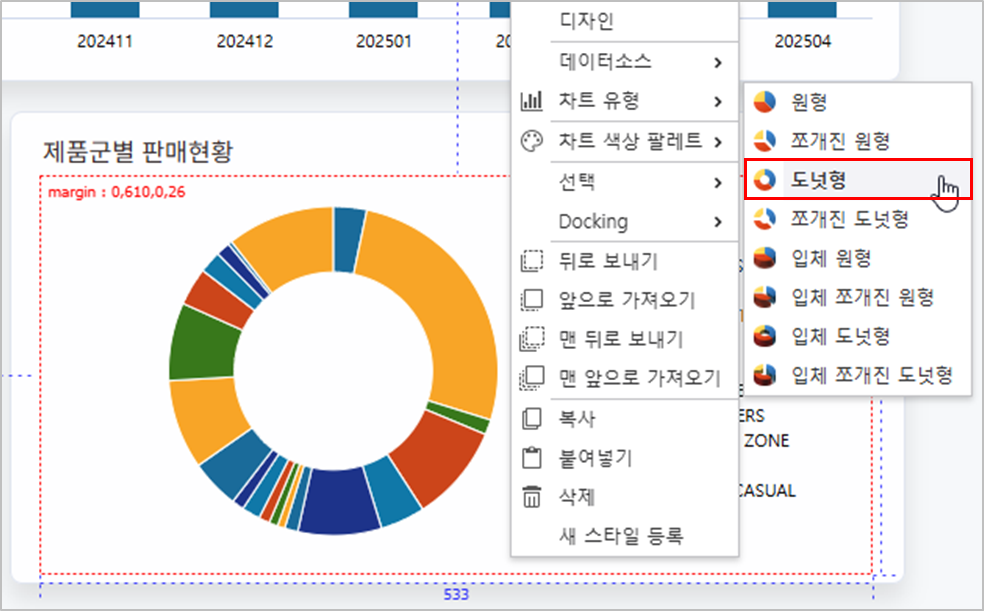
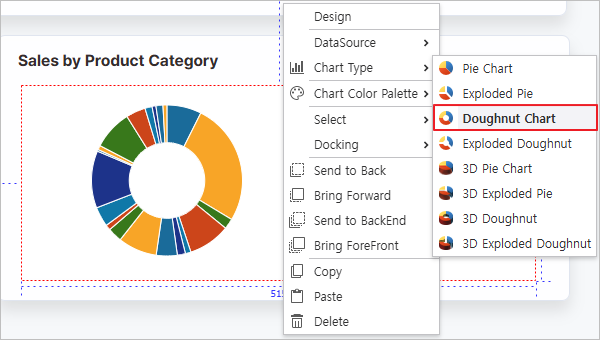
Pie-Chart 컨트롤을 우 클릭하여 디자인 창을 실행한 후 디자인 속성을 변경합니다.
계열 범례 - 레이블 필드 : [상품중분류]
- 값 필드 : [매출금액] 서식
- Label Field : [Product Subcategory]
- Value Field : [Revenue Amount]
- Format : {0:N0}
- 위치 Position : Middle, Right
- 방향 Direction : Vertical
Right-click the Pie-Chart to launch the Design window and modify visual attributes.
| Series | Legend |
|---|---|
보고서가 정상적으로 작동하는지 확인합니다Verify the report is functioning correctly.

Step 4. Configure Process Bot
...
Orchestrate automated dashboard actions and styling using Process Bot을 활용하여 보고서의 동작을 설정합니다.
4.1
...
보고서를 조회할 수 있는 버튼을 설정합니다.
...
Create Inquiry Button
Configure a button to view the report.
- Create a Button control

- Modify the control attributes.
- Name : BTN_RE
- Text : 조 회Refresh
- Style > BoxStyle : BTN1

생성한 버튼을 우 클릭하고, 동작설정 메뉴에서 Refresh를 선택합니다.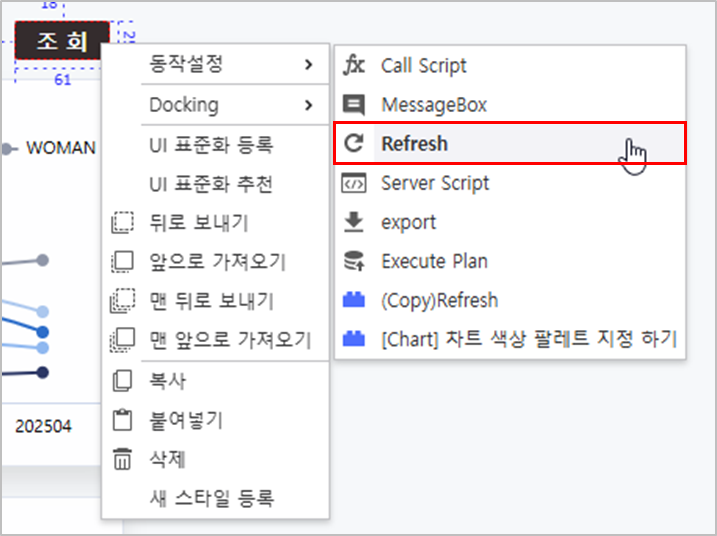
모듈 파라미터 설정 아이콘( )을 클릭하여,Refresh 동작을 설정합니다.
Refresh 대상
- Right-click the generated button and select Refresh from the Operation Settings menu.

- Click the Module Parameter icon () to configure the Refresh action.
Refresh Target : PieChart, OlapGrid1, OlapGrid2, OlapGrid3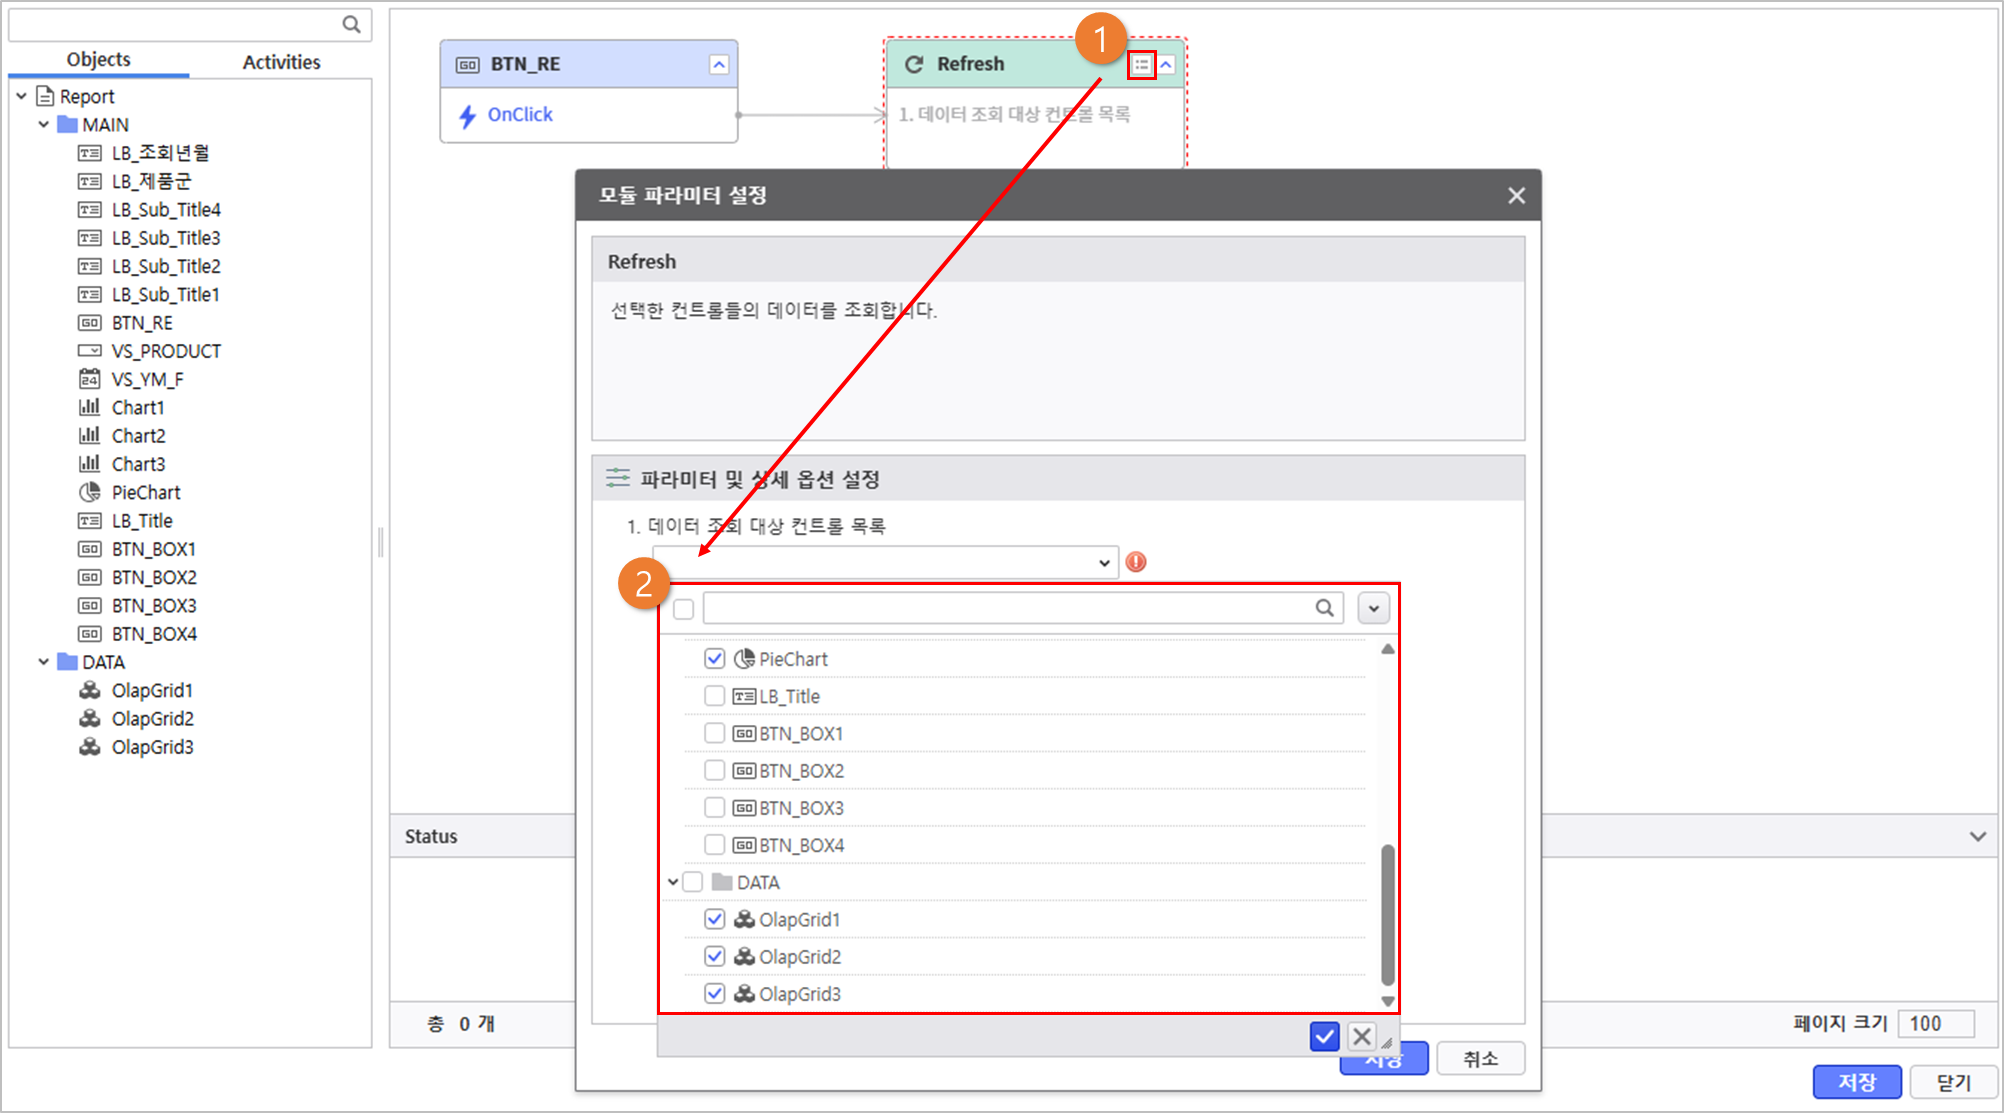
4.2
...
Module을 활용하여 차트의 색상을 설정합니다.
Set Chart Colors
Set the chart colors using a module.
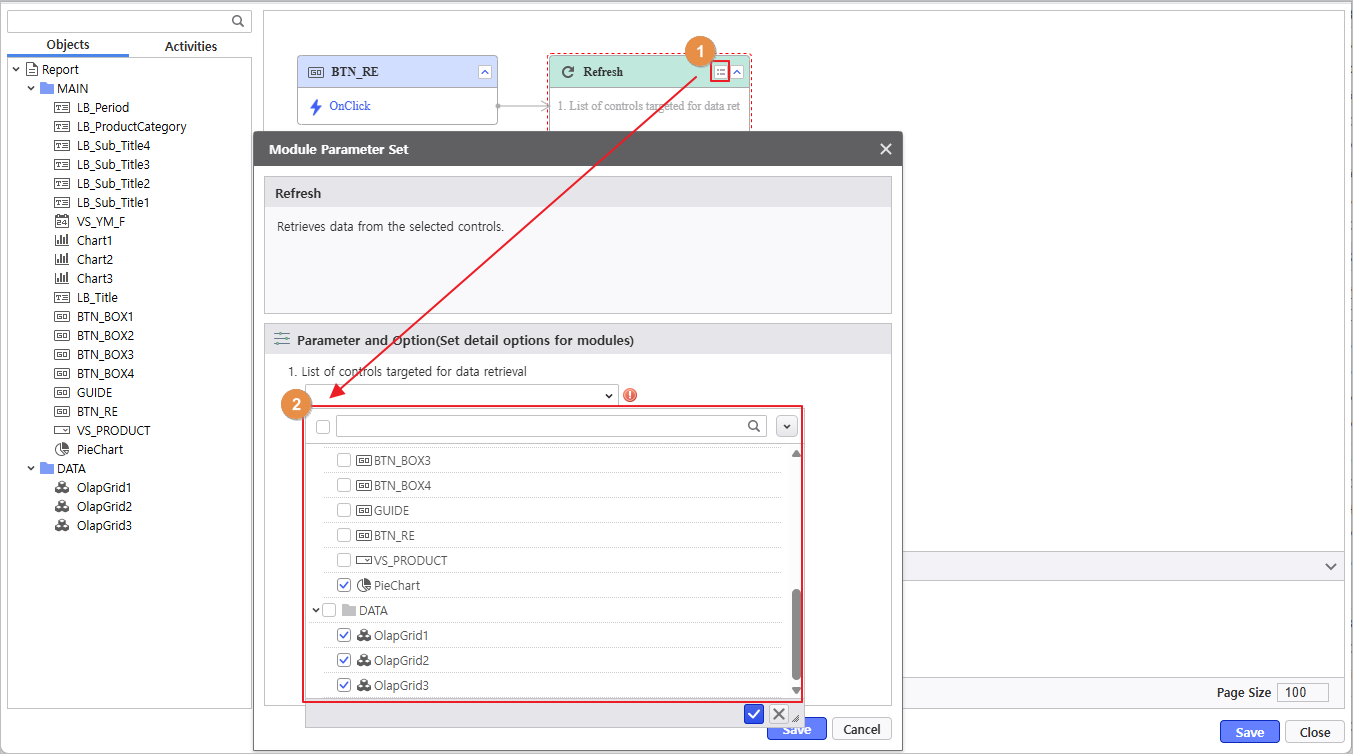
- Click the Process Bot 아이콘icon (
 )을 클릭하여 프로세스 봇 창을 실행하고, Report 를 더블 클릭합니다.
to launch the window and double-click the Report object.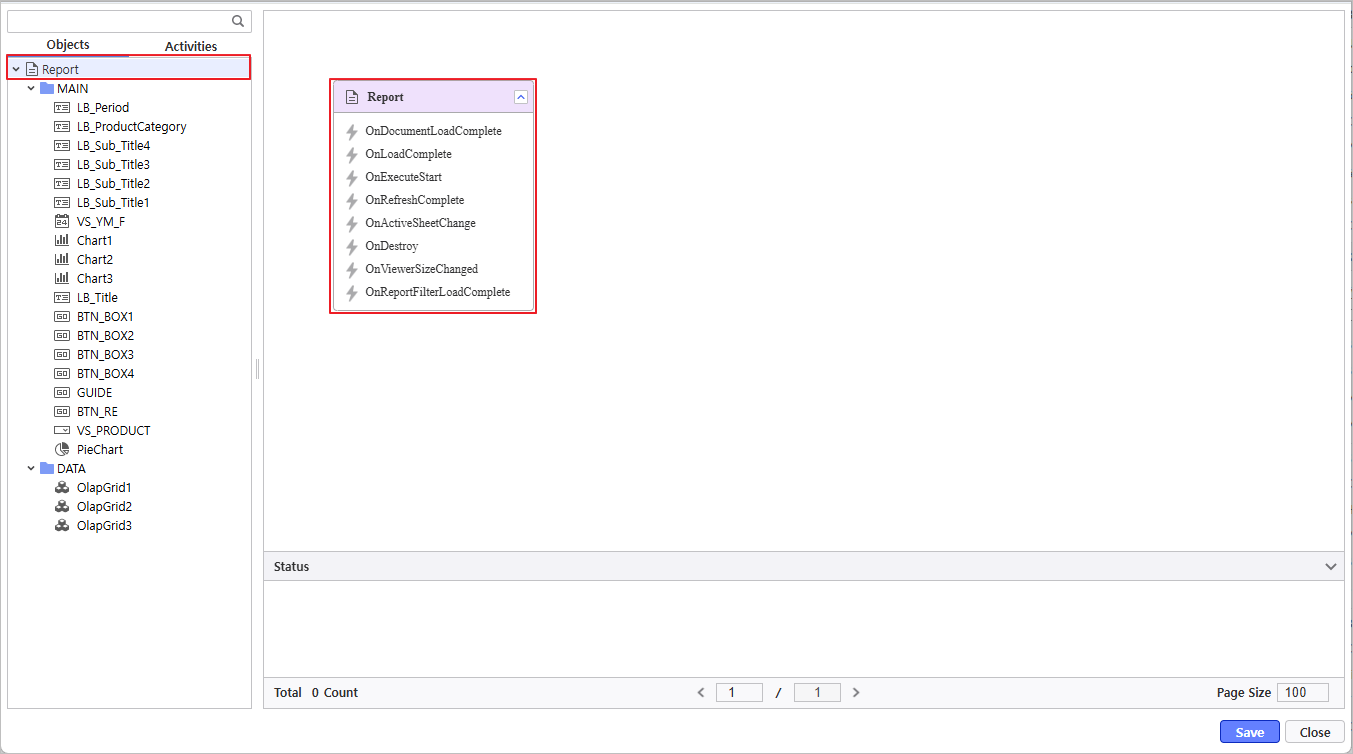
- Navigate to Activities > Modules > 컨트롤별 Control Management > Chart > [Chart] 차트 색상 팔레트 지정 하기 모듈을 선택하고 값을 설정합니다.
차트 선택 Change Chart Palette to select the module and set values.- Chart Selection : PieChart, Chart1, Chart2, Chart3색상 값 입력
파라미터 설정이 완료되면 Report > OnDocumentLoadComplete 이벤트에 '[Chart] 차트 색상 팔레트 지정 하기' 모듈을 연결합니다.
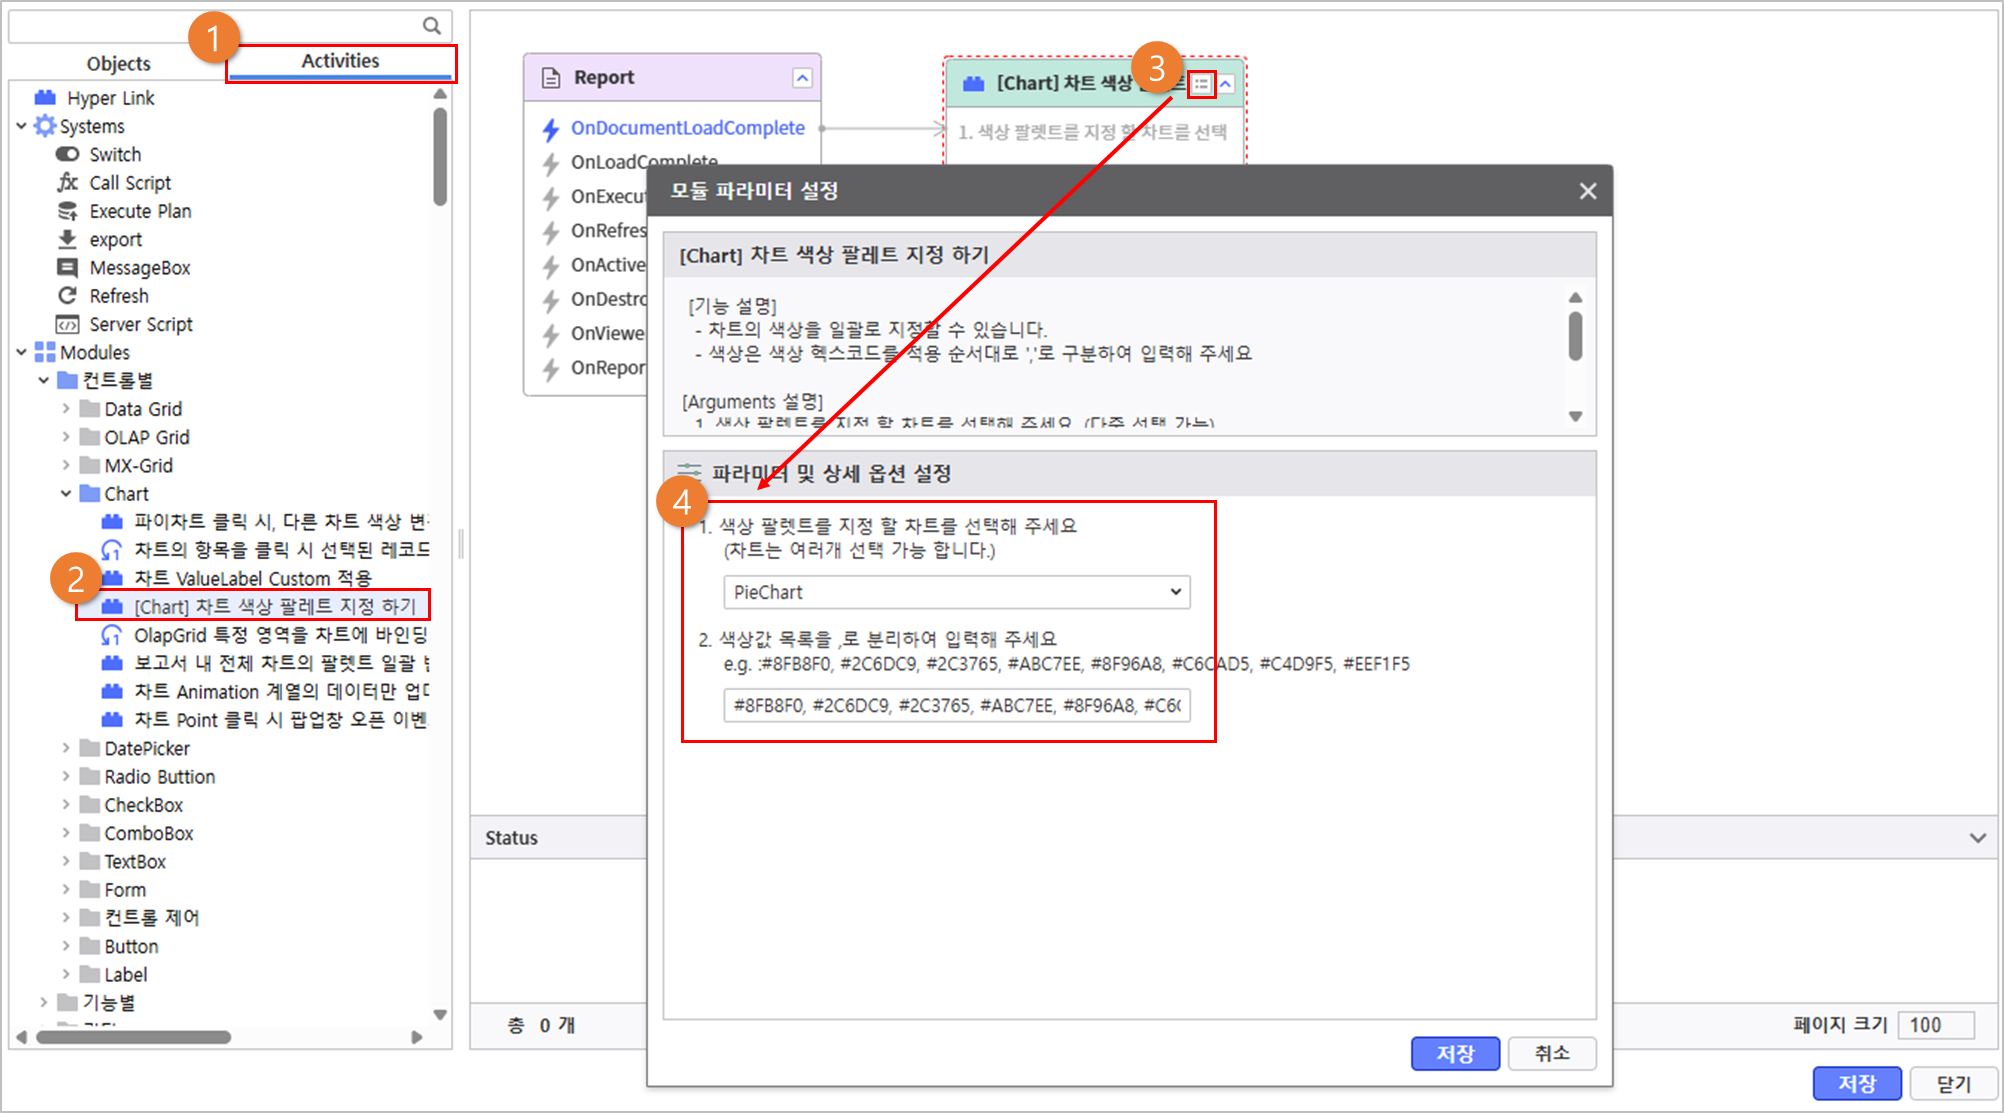
- Enter Color Values
Once the parameter configuration is complete, link the 'Change Chart Palette' module to the OnDocumentLoadComplete event of the Report.
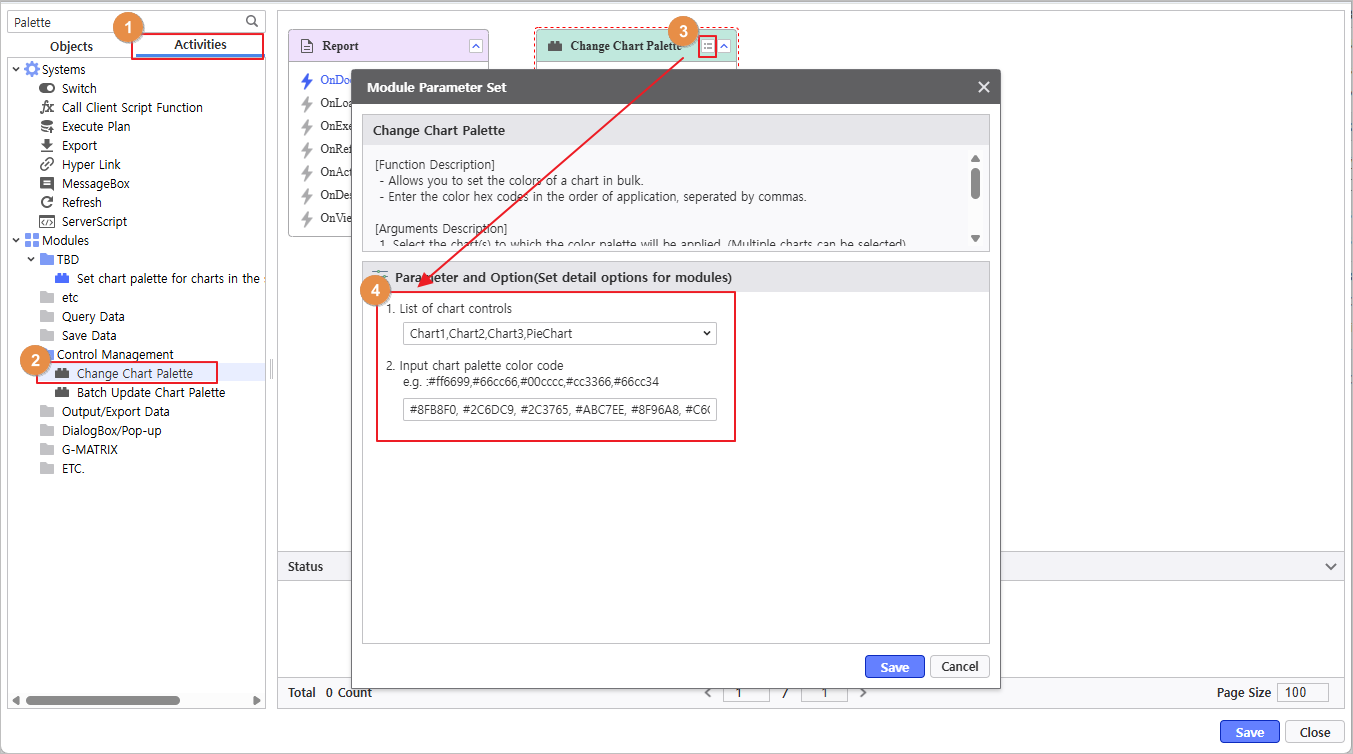
참고사항 icon false title Discription Description Used Color Codes
#8FB8F0, #2C6DC9, #2C3765, #ABC7EE, #8F96A8, #C6CAD5, #C4D9F5, #EEF1F5
- Chart Selection : PieChart, Chart1, Chart2, Chart3색상 값 입력
보고서가 정상적으로 작동하는지 확인합니다Verify the report is functioning correctly.