| Easy Heading Macro | ||||||||
|---|---|---|---|---|---|---|---|---|
|
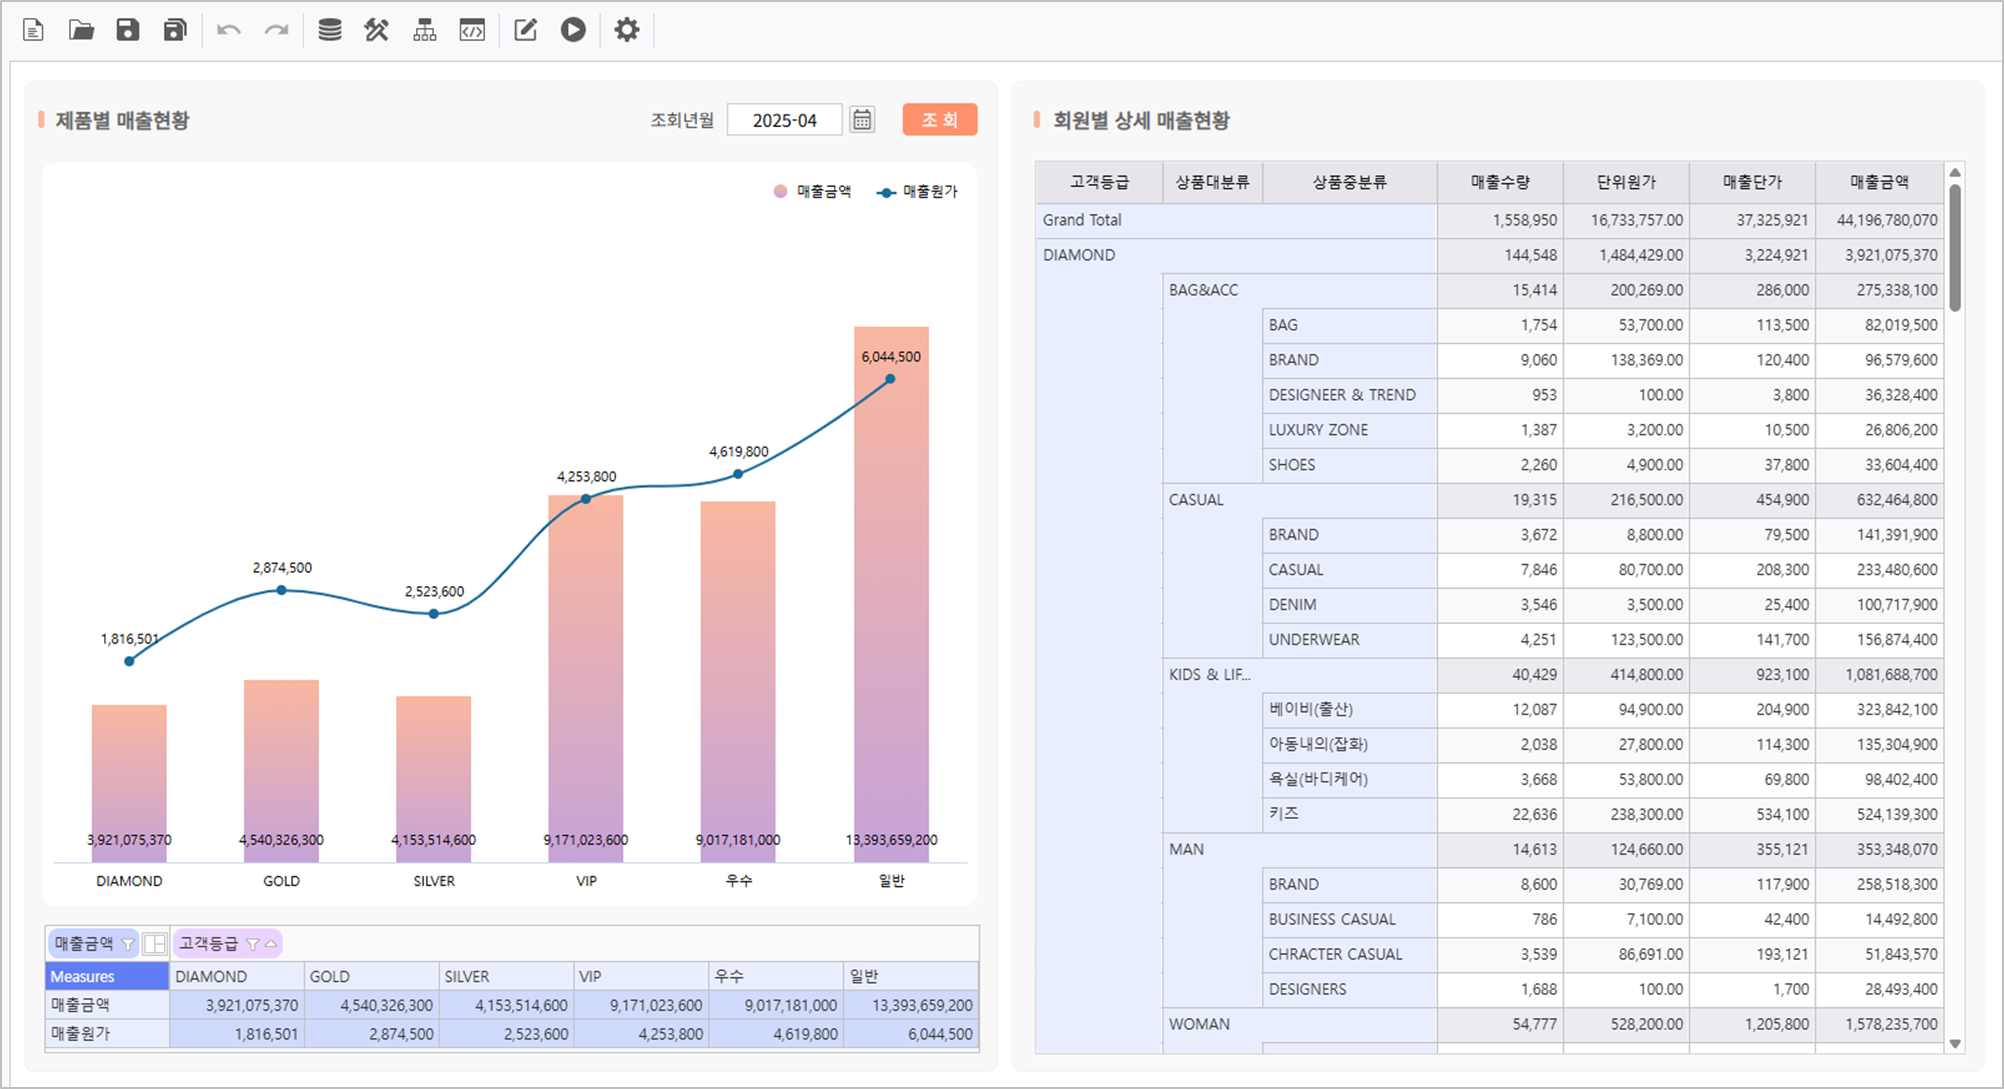
목표화면Target Screen |
|---|
|

Step 1.
...
Set Query Condition
In i-AUD Designer, create a query condition Control and set query condition for data.
1.1
...
Create Control
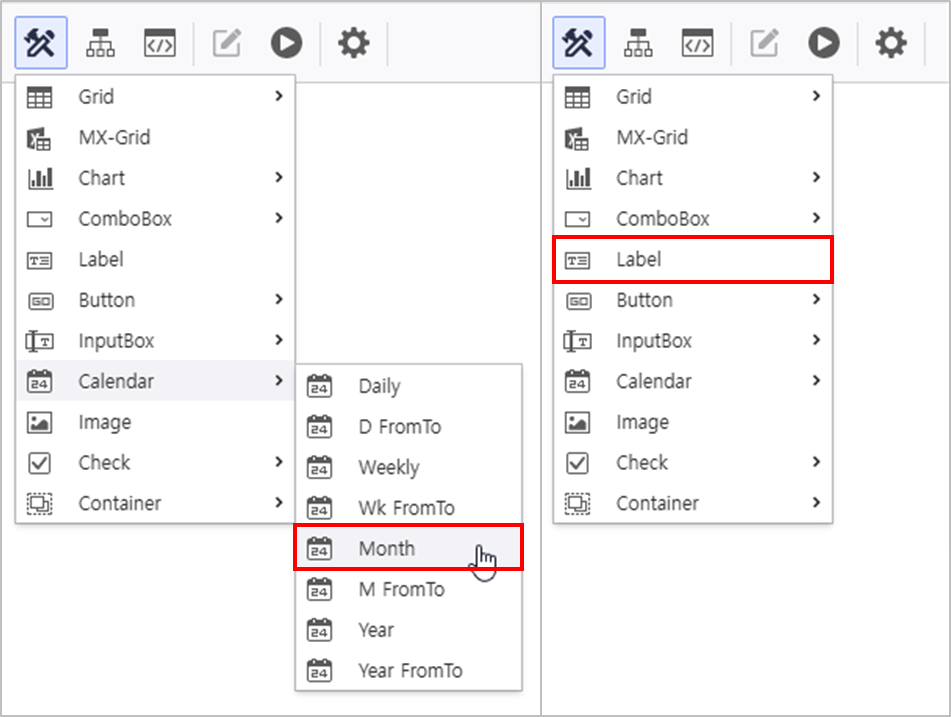
- At the top menu, click UI Bot > Calendar, Label을 클릭해 컨트롤을 생성합니다 to create a label Control.
1.2
...
Set Properties of Each Control
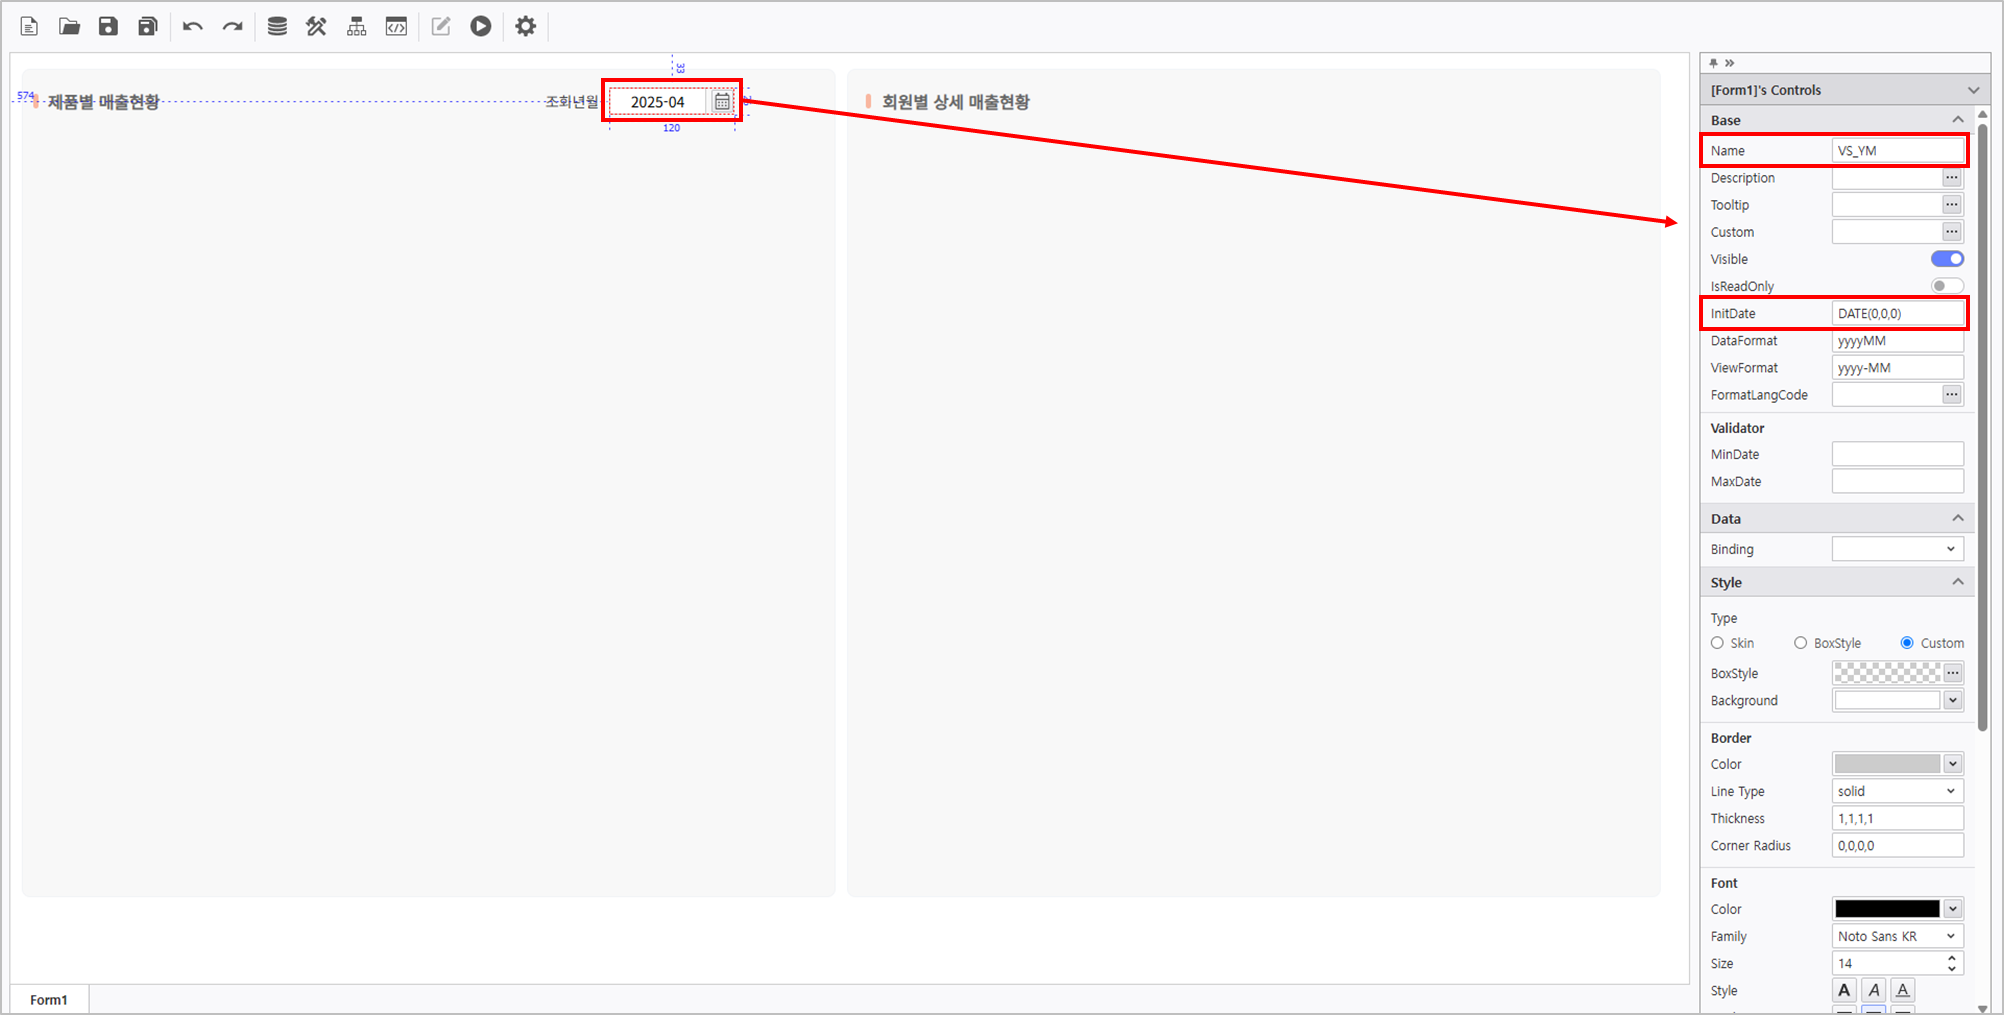
- In the Properties Modification panel on the right, set the properties of the Calendar Control as below.
- Name : VS_YM
- InitDate : Now() 또는 or DATE(0,0,0)
Label 컨트롤의 속성도 설정합니다도움말 title Calendar 속성 설정 가이드 Calendar 속성 설정과 관련된 가이드를 참고하려면 하단의 여기로 이동하세요.
Property Configuration Guide For detailed information about Calendar Property Configuration, please refer to the Link.
Set the property of the Label Control.
Name Text Label조회년월 Query Year and Month 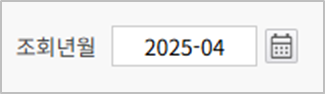
1.3
...
Create a Query Button Control
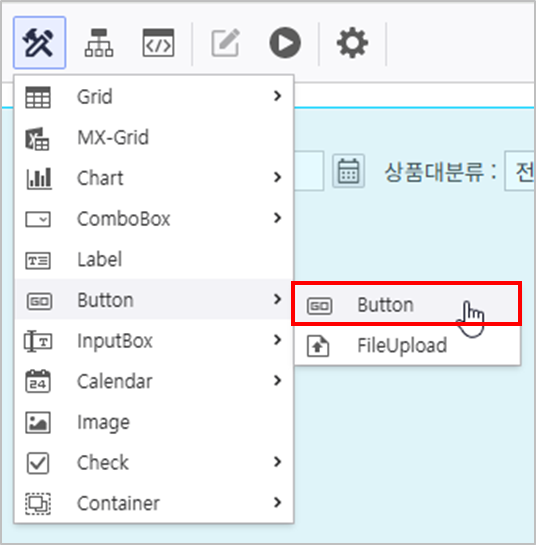
- At the top menu, go to UI Bot > Button을 클릭해 Button 컨트롤을 생성합니다Button and create a Button Control.
- 우측 컨트롤 속성 편집 영역에서 다음과 같이 속성을 설정합니다In the Properties Modification panel on the right, set the properties as the following.
- Name : Button
- Text : 조 회Search
- Background : #ff926c
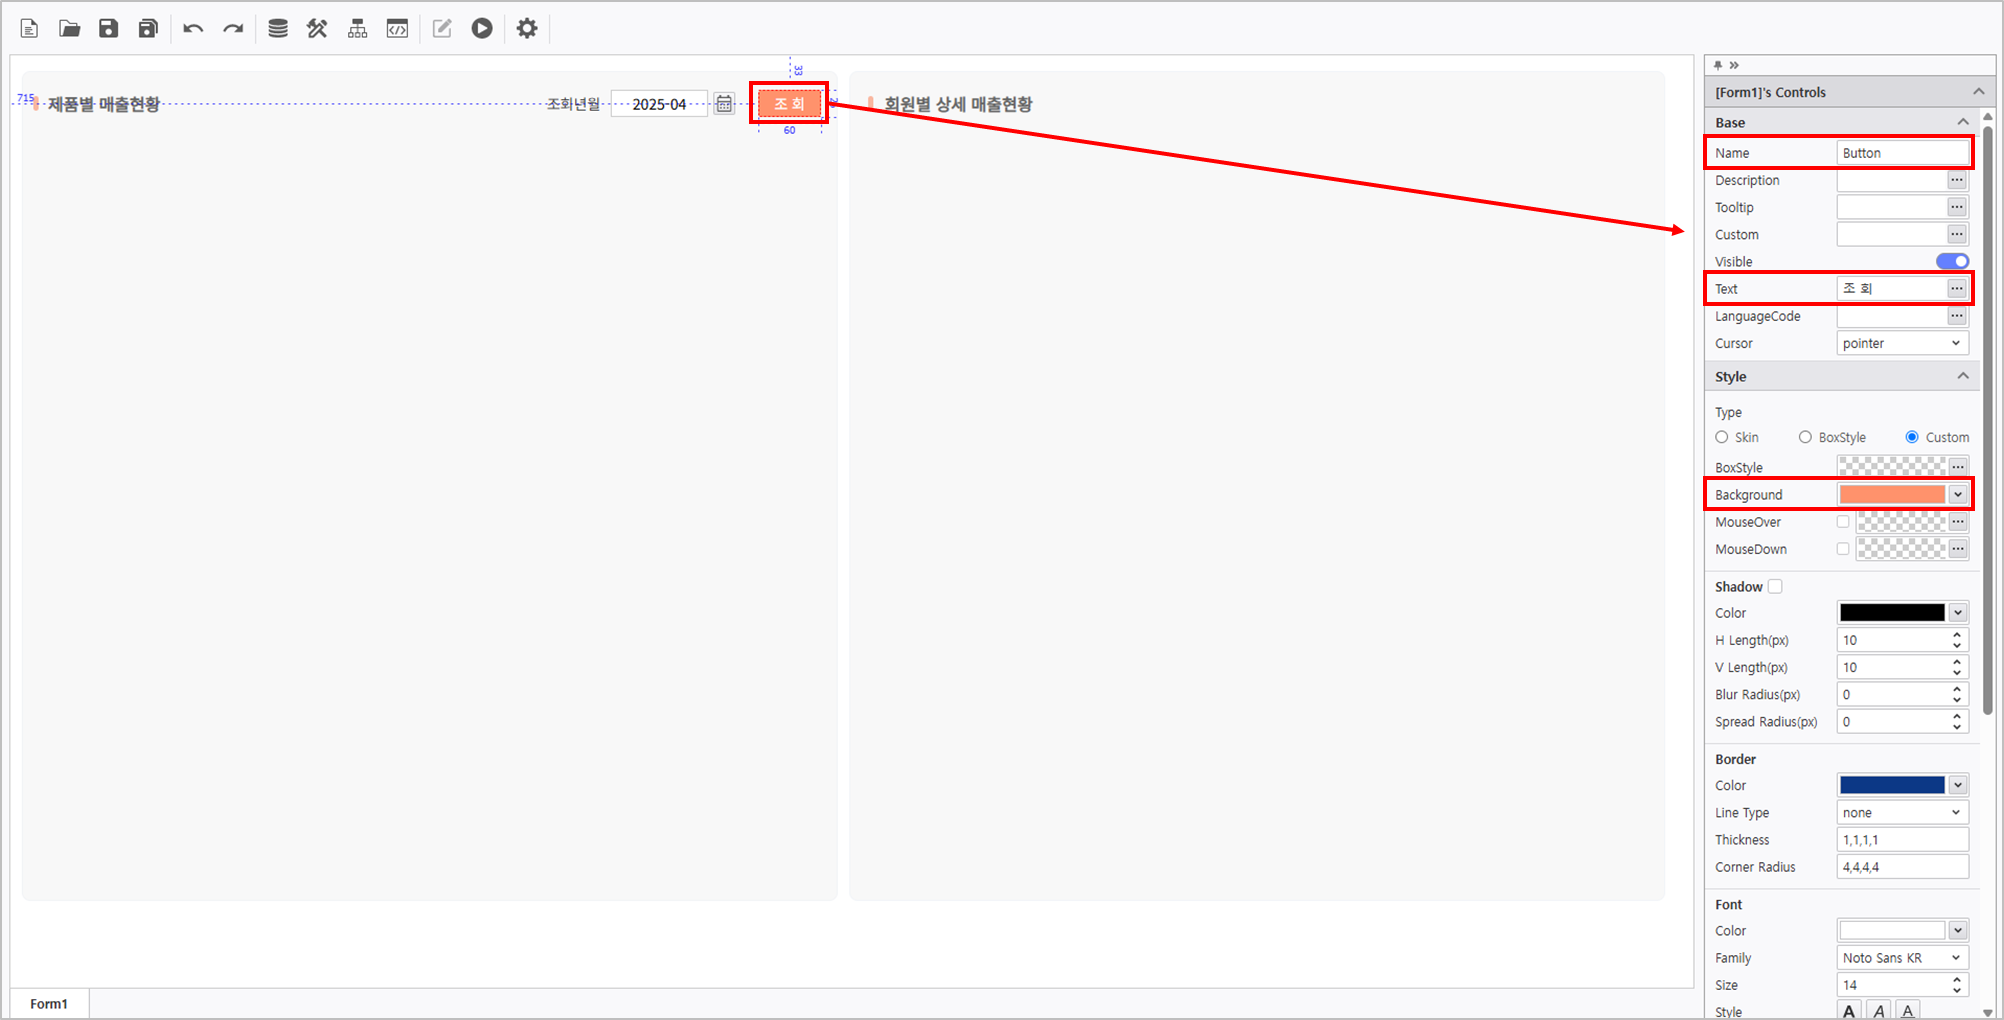
- 조회 조건 컨트롤이 잘 배치되었는지 확인합니다Verify that the Query Condition Control is placed as below image.

Step 2.
...
Connect Chart to OlapGrid
...
Create and connect a OlapGrid and a Chart to display Sales Performance by Product.
2.1 Set OlapGrid
...
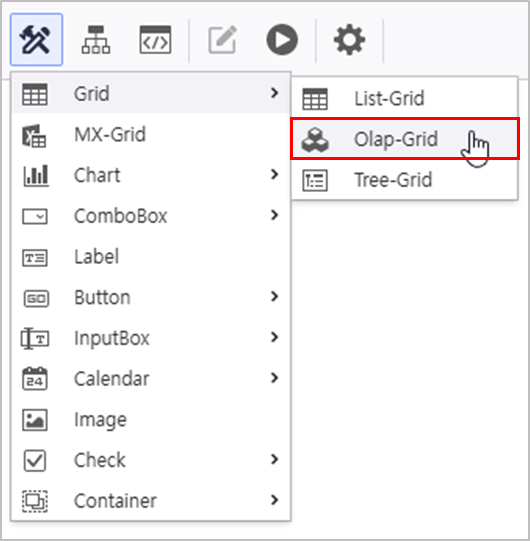
- Create a OlapGrid 생성
- Go to UI Bot > Grid > "Olap-Grid"
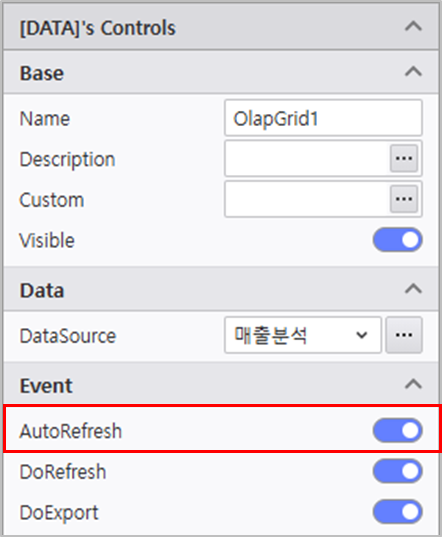
매출분석 META 활용해 데이터 소스를 연결하고, AutoRefresh를 활성화 합니다Connect datasource using Sales Analysis META, and activate AutoRefresh.
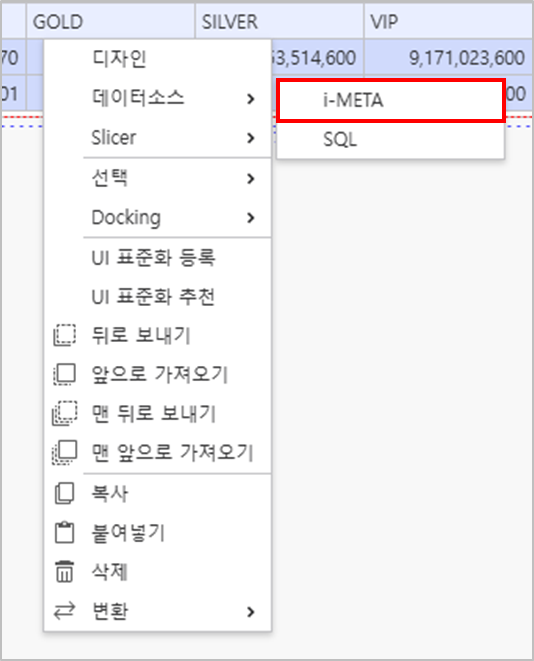
정보 title Connecting OlapGrid 데이터 소스 연결 DataSource Right-click the OlapGrid > DataSource > i-META > Select META 파일 선택
매출분석 경로file
- Sales Analysis Location : TBD > Sample > 3.Templates > OLAP > "매출분석Sales Analysis"
정보 title AutoRefresh 활성화 Activation Activate AutoRefresh in the property panel on the right of the OlapGrid.
조회 항목 조회 조건 변수Query Item Query Condition Variable - Column : [고객등급Customer Tier]
- Data : [매출원가Sales Cost, 매출금액Sales Amount]
[년월YM] :VS_YM 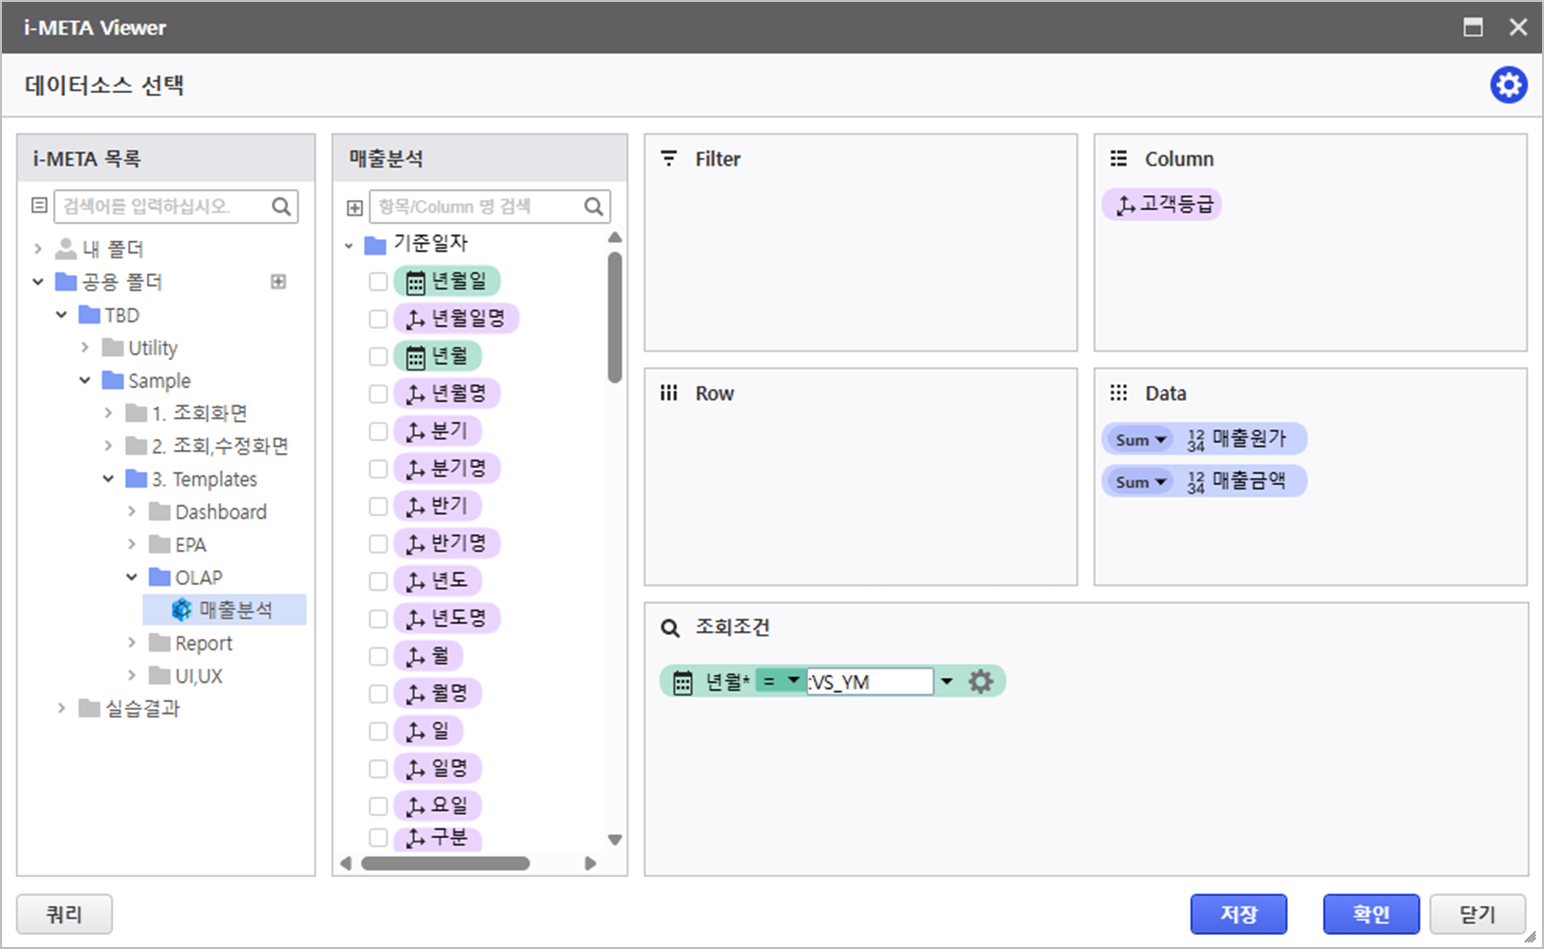
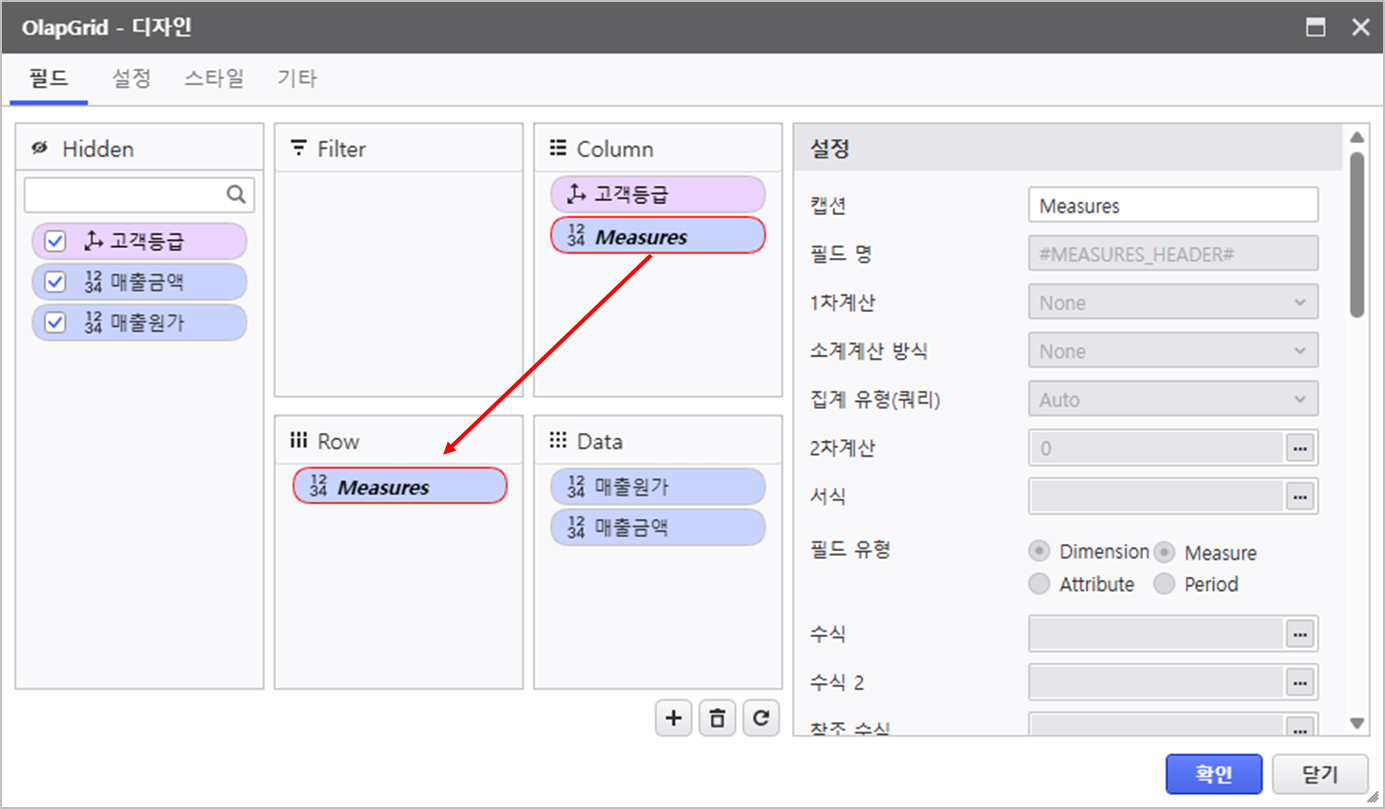
우 클릭하여 디자인 메뉴를 실행한 후 디자인 속성을 변경합니다.
필드 설정 기타Right-click to open Design menu, and modify the design property.
Field Setting Other Settings - [Measures] 필드 위치 변경 field position changed :
Column > Row
- 자동 선택 영역 활성화
- 범위 : 오른쪽 5, 아래쪽 1
- Enable auto selection area
- Range : Right 5, Down 1
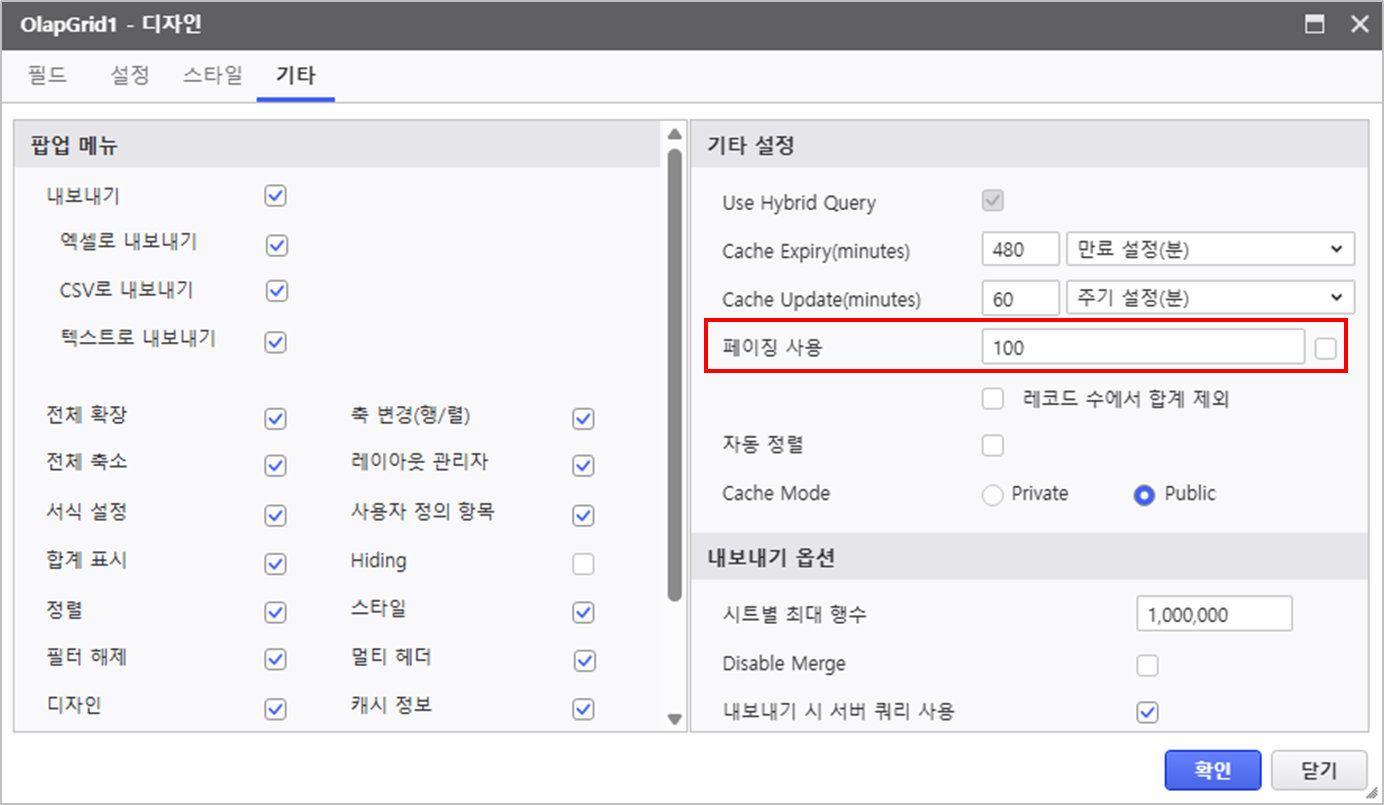
- Disable Using Paging
펼치기 title 상세 속성 설정Detail Property Configuration - [Measures] 필드 위치 변경 Field Position Changed : Column > Row
- 자동 선택 영역 비활성화Enable Auto Selection Area
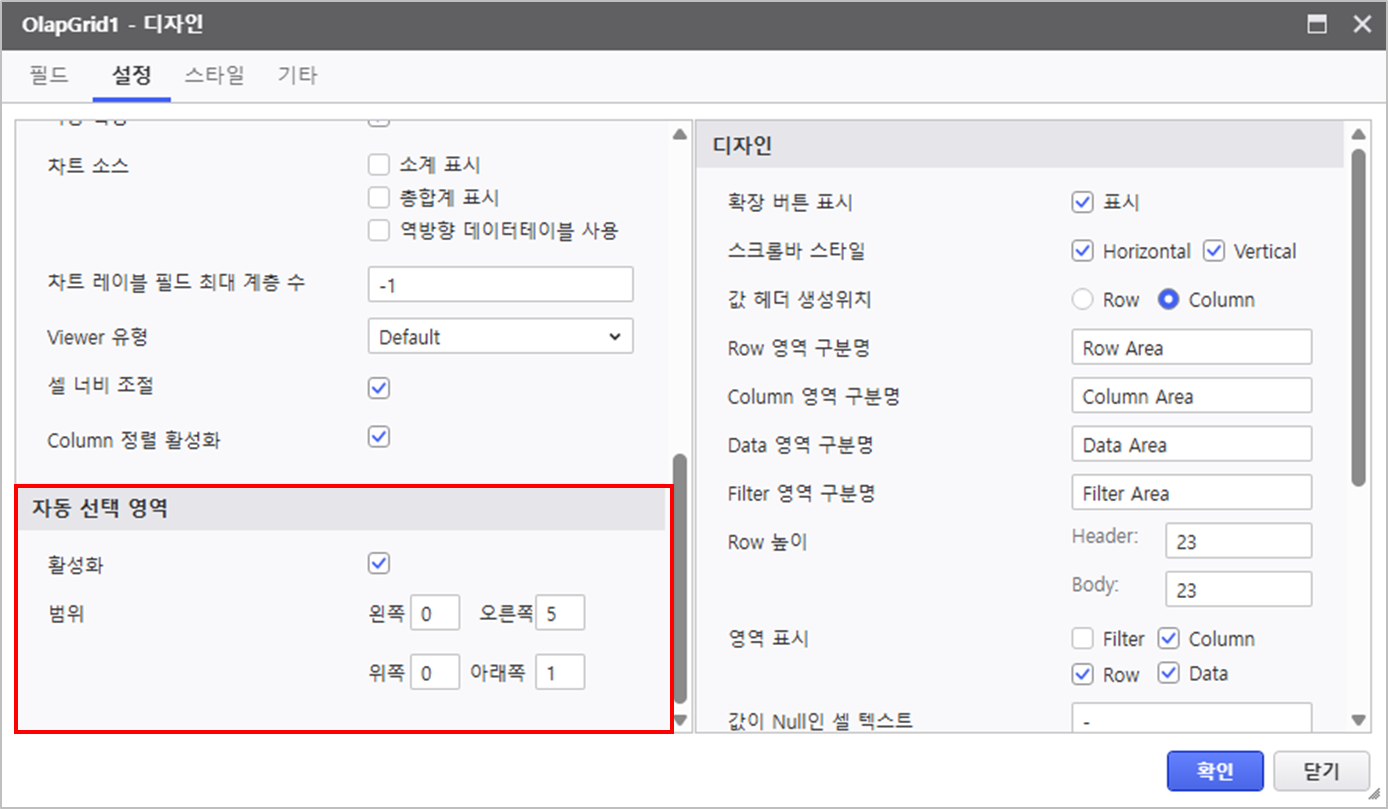
- 페이징 사용 비활성화Disable Using Paging
- [Measures] 필드 위치 변경 field position changed :
2.2 Chart
...
Configuration
- Create a Chart 컨트롤 생성Control
- Go to UI Bot > Chart > , and select Chart 생성
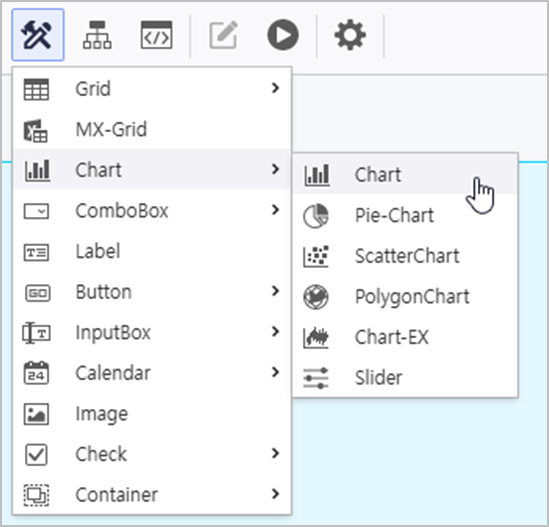
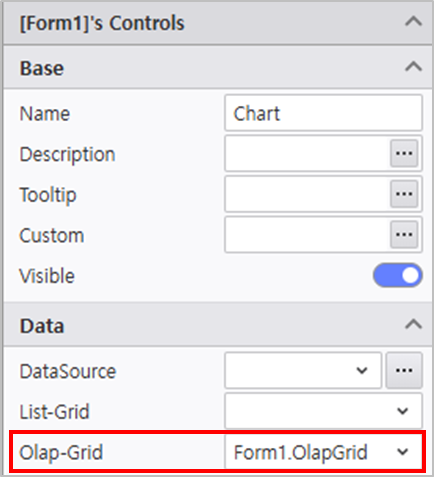
- 우측 속성 메뉴에서 Chart 속성을 설정합니다In the property menu on the right, configure the Chart property.
- Olap-Grid : Form1.OlapGrid
디자인 메뉴를 클릭하여 디자인 속성을 변경합니다.
기본 계열 축 범례 Click the Design menu to modify the design property.
Default Series Axis Legend - Data Label : Value
- [매출원가Sales Cost] > 차트 유형 : 곡선형Chart Type : Line Chart
- [매출원가Sales Cost] 축Axis : Y2
- [매출원가Sales Cost] > 기타 Other > 레이블정렬Sort Label : TopCenter
- [매출금액Sales Amount] > 기타 Other > 레이블정렬Sort Label : BottomCenter
- Y1축 : 표시 비활성화
- X축 > 디자인 : 주 눈금선 두께 0
- 위치 Y1 Axis : Display Disabled
- X Axis > Design : Major Grid Line width 0
- Position : Top, Right
- 방향 Direction : Horizontal
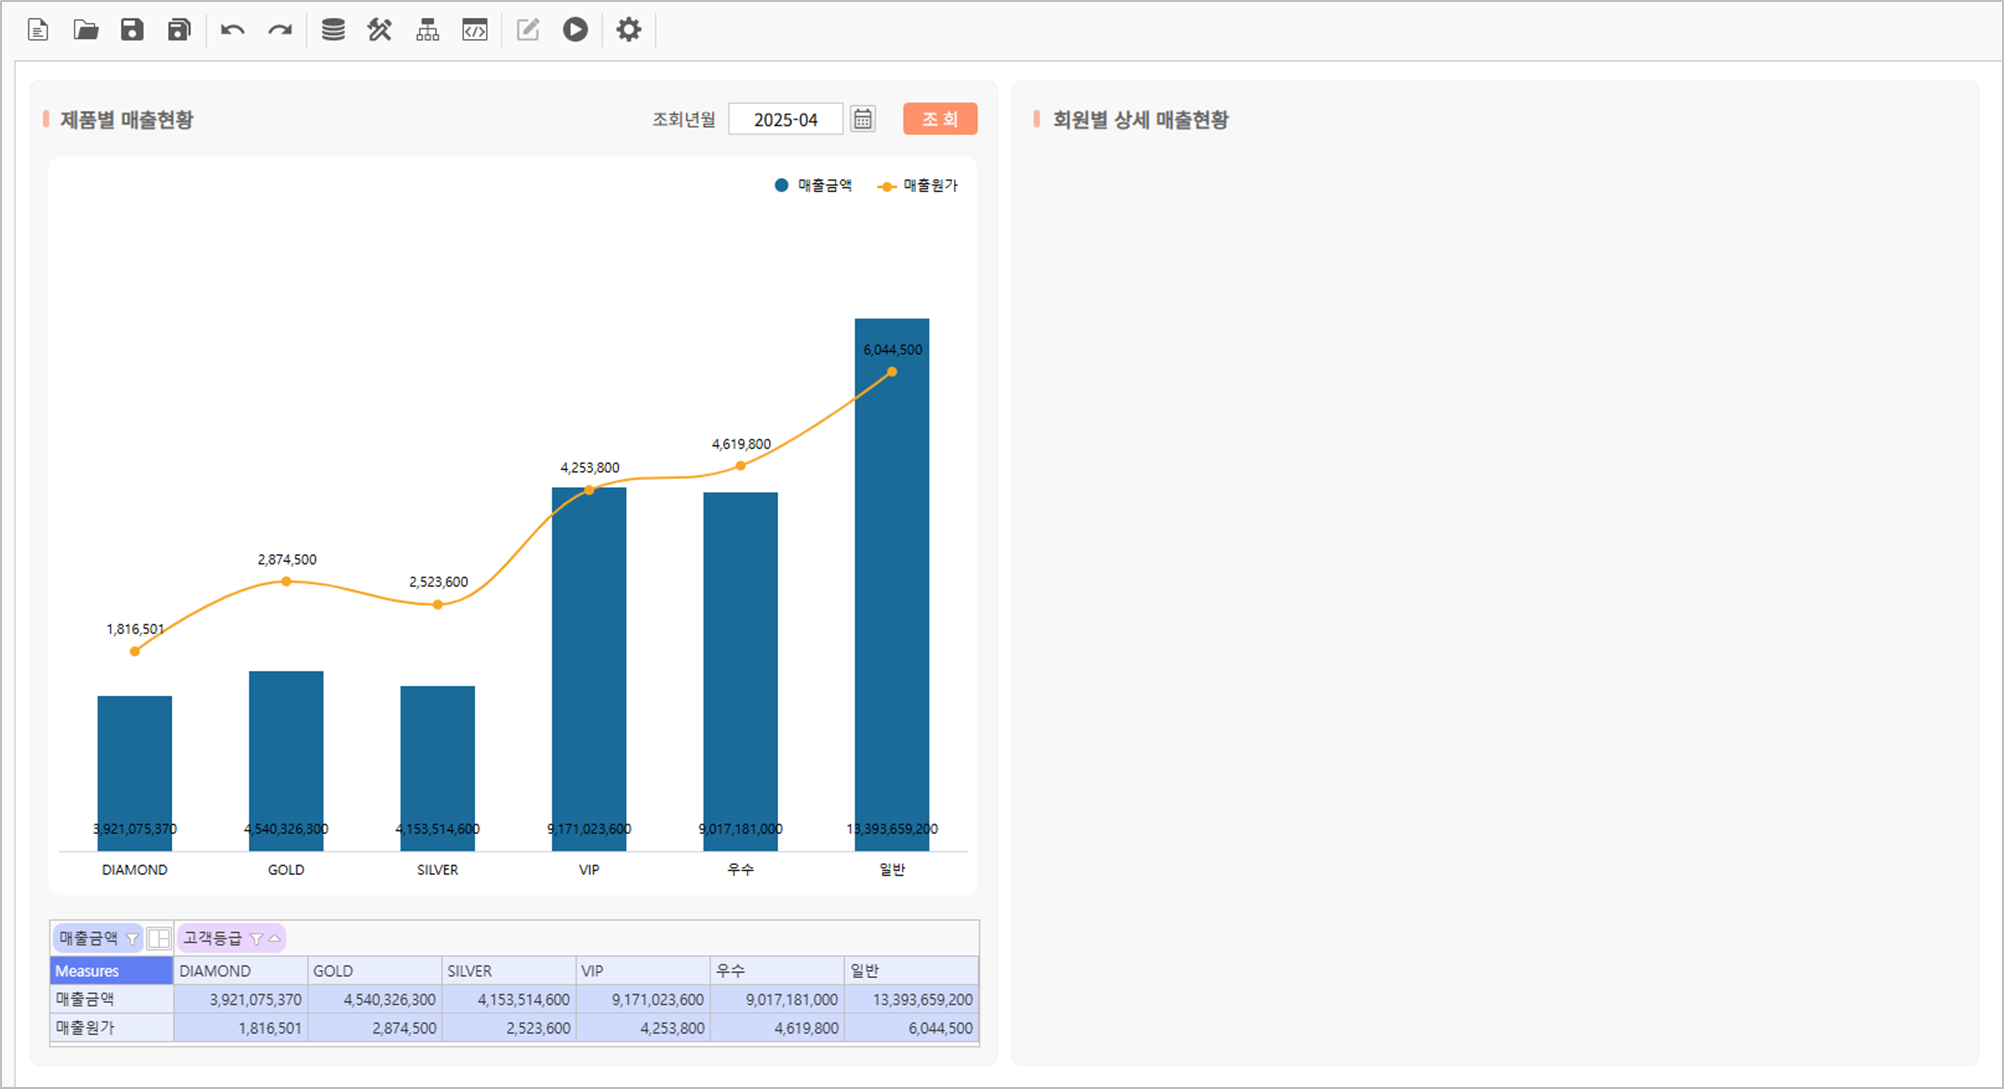
보고서가 정상적으로 동작하는지 확인합니다Verify that the report is working as expected.
Step 3. Set ListGrid
...
상세 매출현황을 나타낼 ListGirid를 설정합니다.
Set a ListGrid to display Detailed Sales Performance.
- Go to UI Bot > Grid > ListGrid를 생성합니다and create a ListGrid.
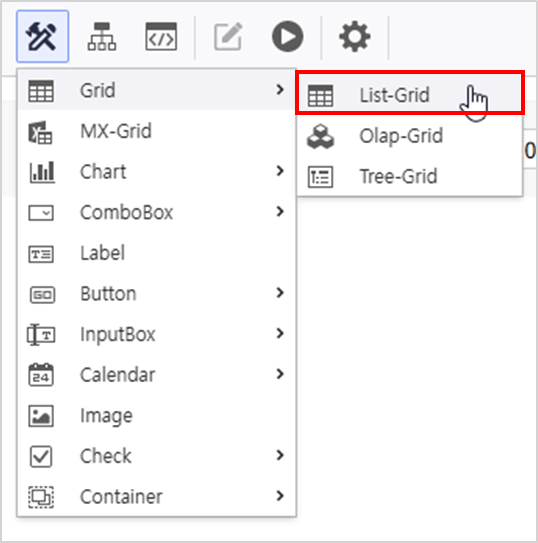
- ListGrid의 속성을 설정합니다Set properties of the ListGrid.
- Name : DG_DETAIL
- AutoRefresh : 활성화Activate
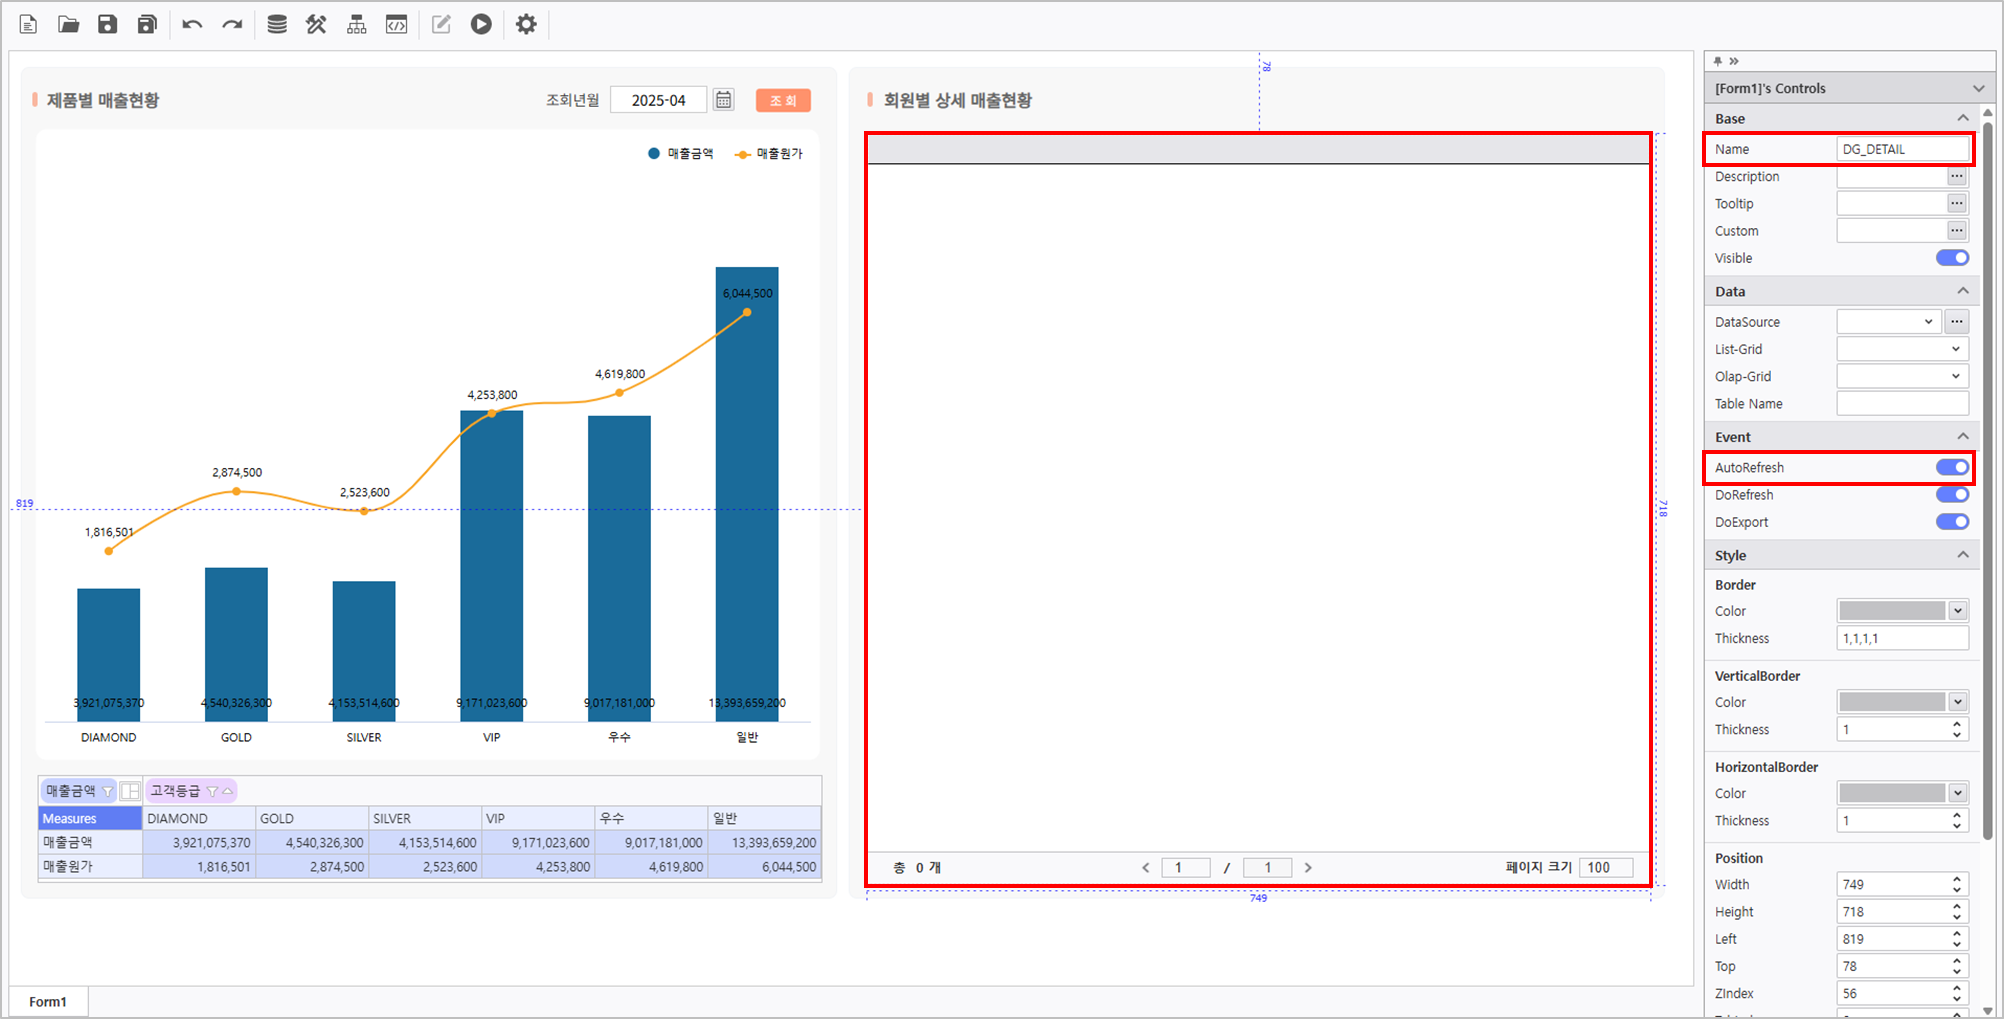
매출분석 META 활용해 데이터 소스를 연결하고, AutoRefresh를 활성화 합니다.
조회항목 조회조건 변수 [고객등급, 상품대분류, 상품중분류,
매출수량, 단위원가, 매출단가, 매출금액]Connect data source using Sales Analysis META, and activate AutoRefresh.
Query Item Query Condition Variable [Customer Tier, Product Category, Product Subcategory,
Sales Quantity, Unit Cost, Sales Cost, Sales Amount][YM]
:VS_YM [고객등급Customer Tier] @:VS_LEVEL 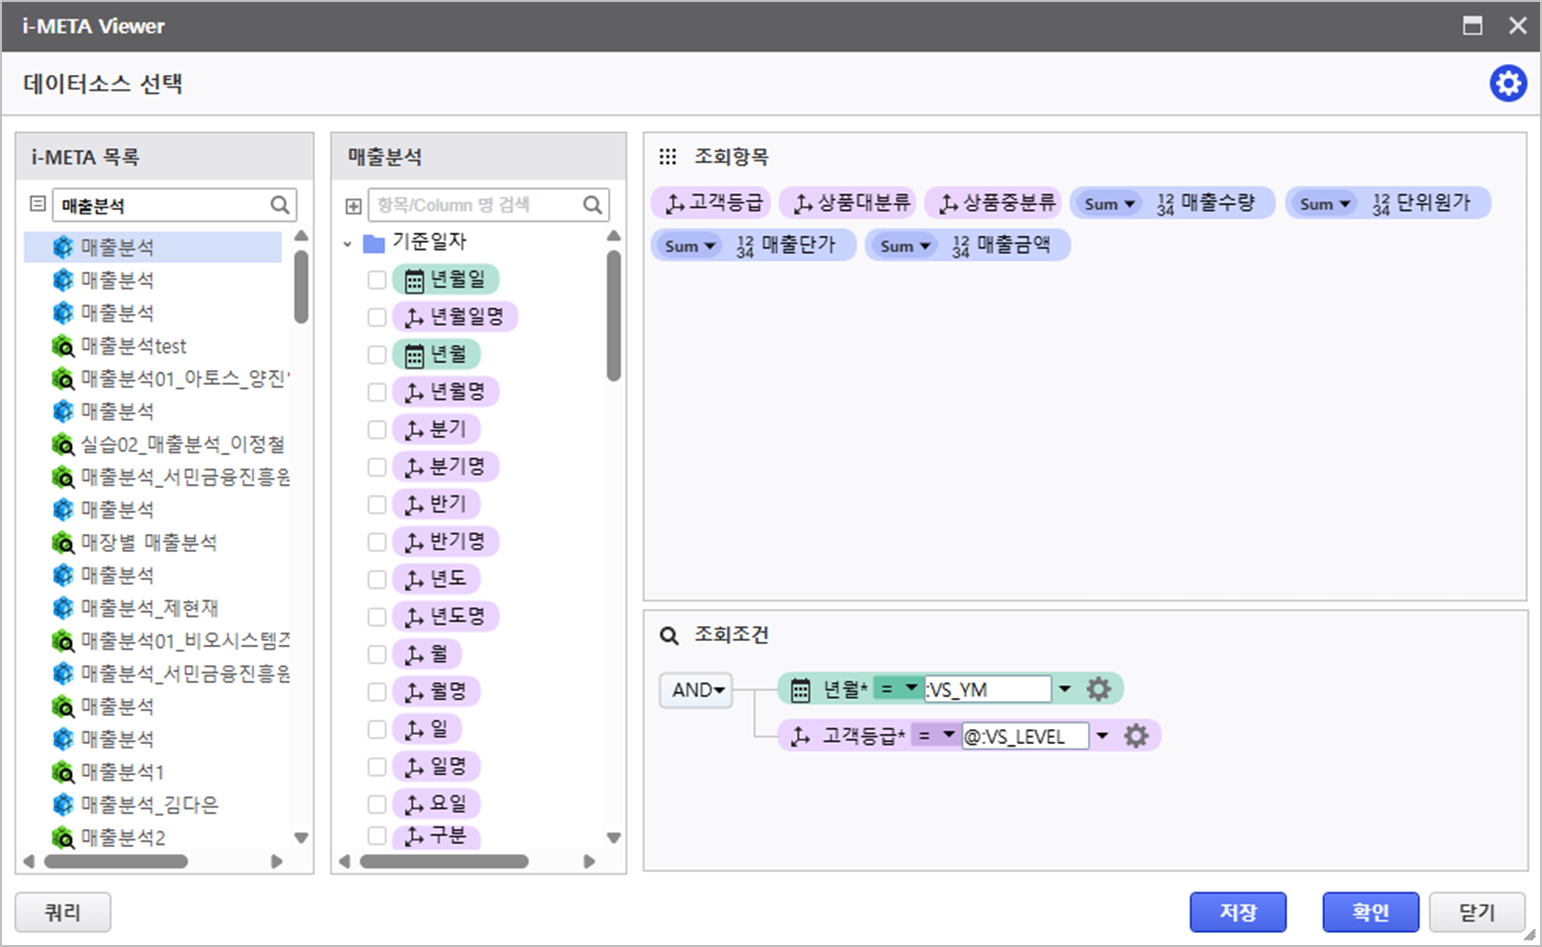
정보 title 변수 이름 설정 Setting Variable Names For more information about AUD Platform Variables, please click here.
- VS_YM :
Calendar 컨트롤의 날짜 값을 기준으로 조회하기 위해 사용하는 변수Variable for querying data based on date value of the Calendar Control
- VS_LEVEL :
[고객등급] 데이터를 기준으로 ListGrid 값을 조회하기 위한 변수Variable for querying ListGrid value based on [Customer Tier] data.
Step 5. Utilizing in Script Editor에서 활용
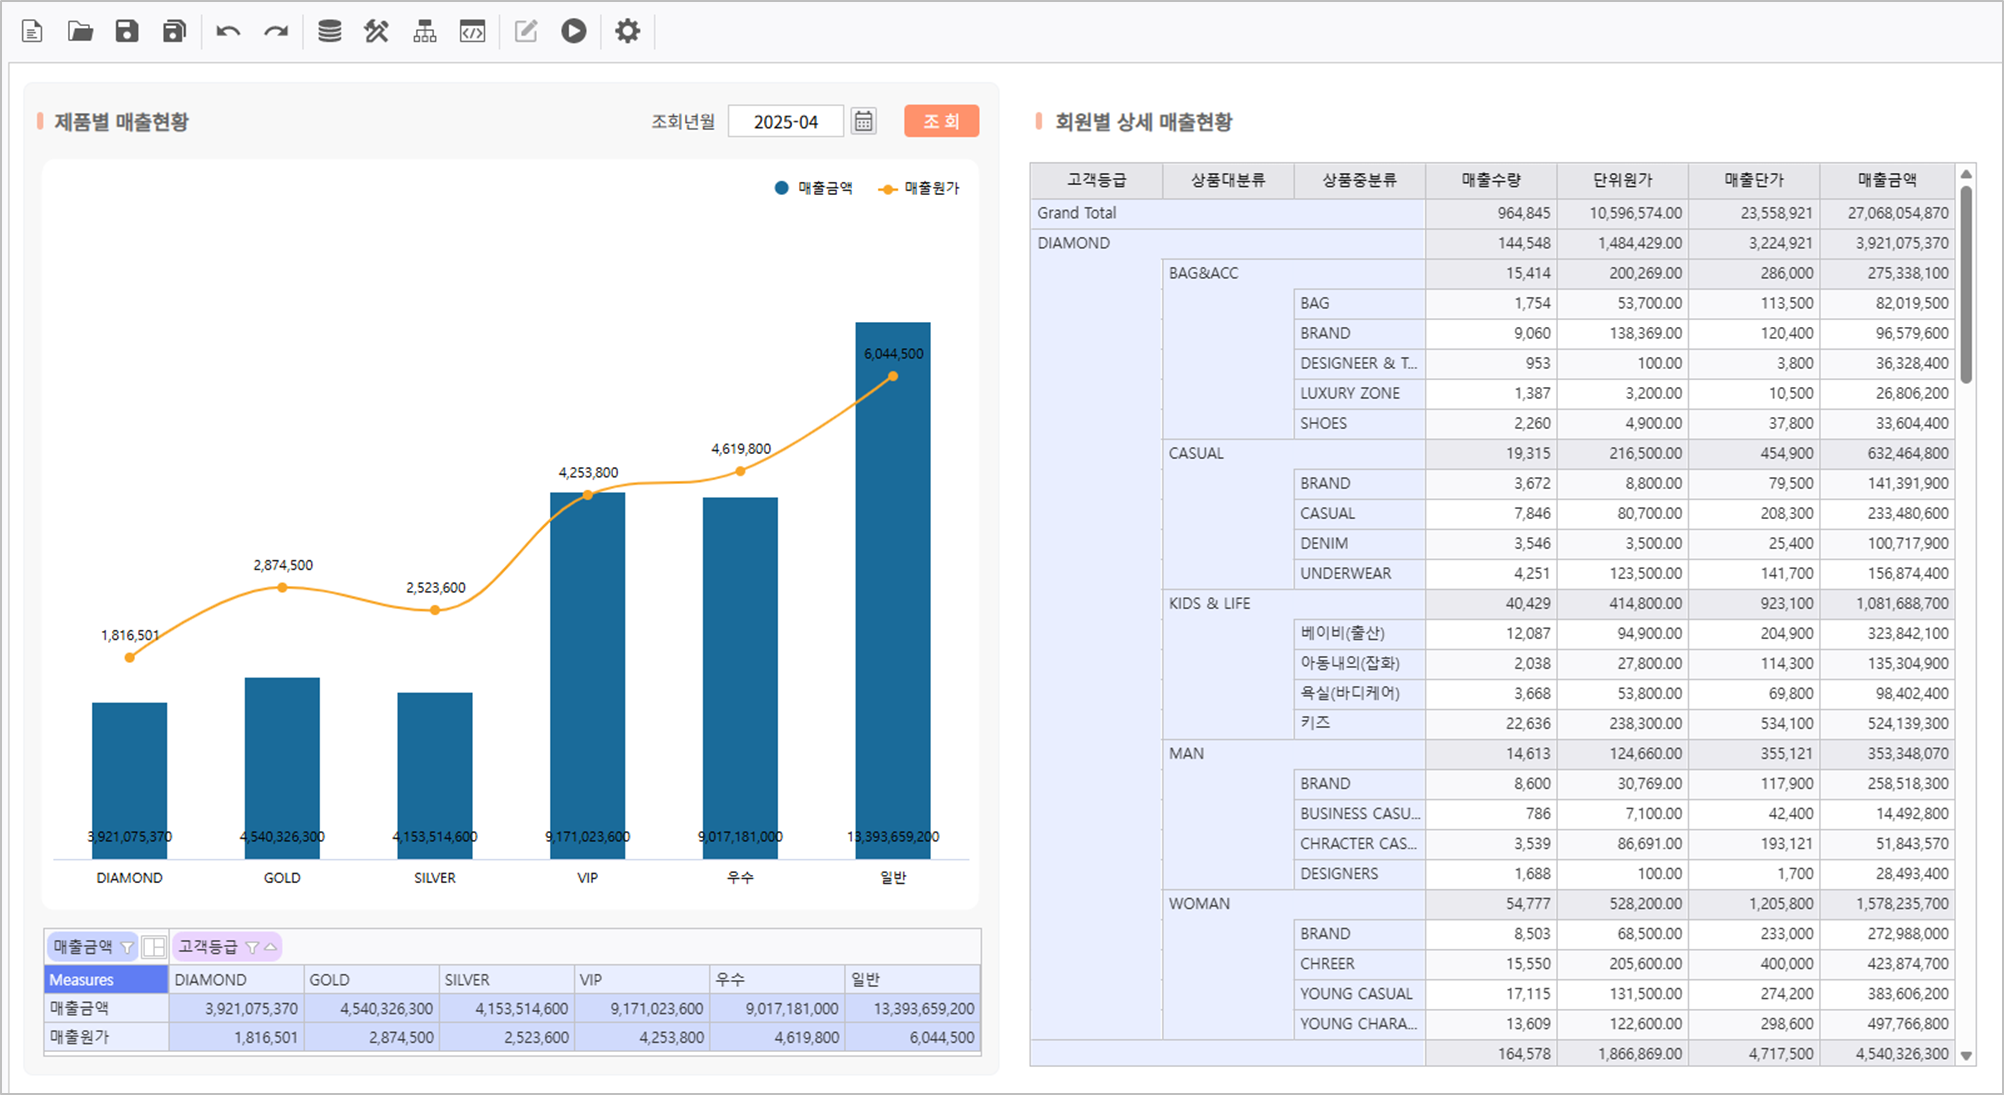
디자인 메뉴를 클릭하여 디자인 속성을 변경합니다.
설정 > 기본 설정 > Group - 헤더보기 > Row : 비활성화
- 그룹 : [고객등급, 상품대분류, 상품중분류]
- 소계 위치 : Top
- 총합계 위치 : Top
- VS_YM :
...
- Editor
- Editor
Click the Design Menu, to modify the design property.
Setting > Default Setting > Group - View Header > Row : Disable
- Group : [Customer Tier, Product Category, Product Subcategory]
- Subtotal Position : Top
- Grand Total Position : Top
Verify that the report is working as expected.
Step 4. Utilizing Process Bot
...
Chart 디자인 효과와 보고서 갱신을 위한 모듈을 설정합니다Set a module for Chart Design Effect and Report Update.
4.1 Chart
...
Gradient Effect Application Module Setting
- Click the Process Bot icon at the top.

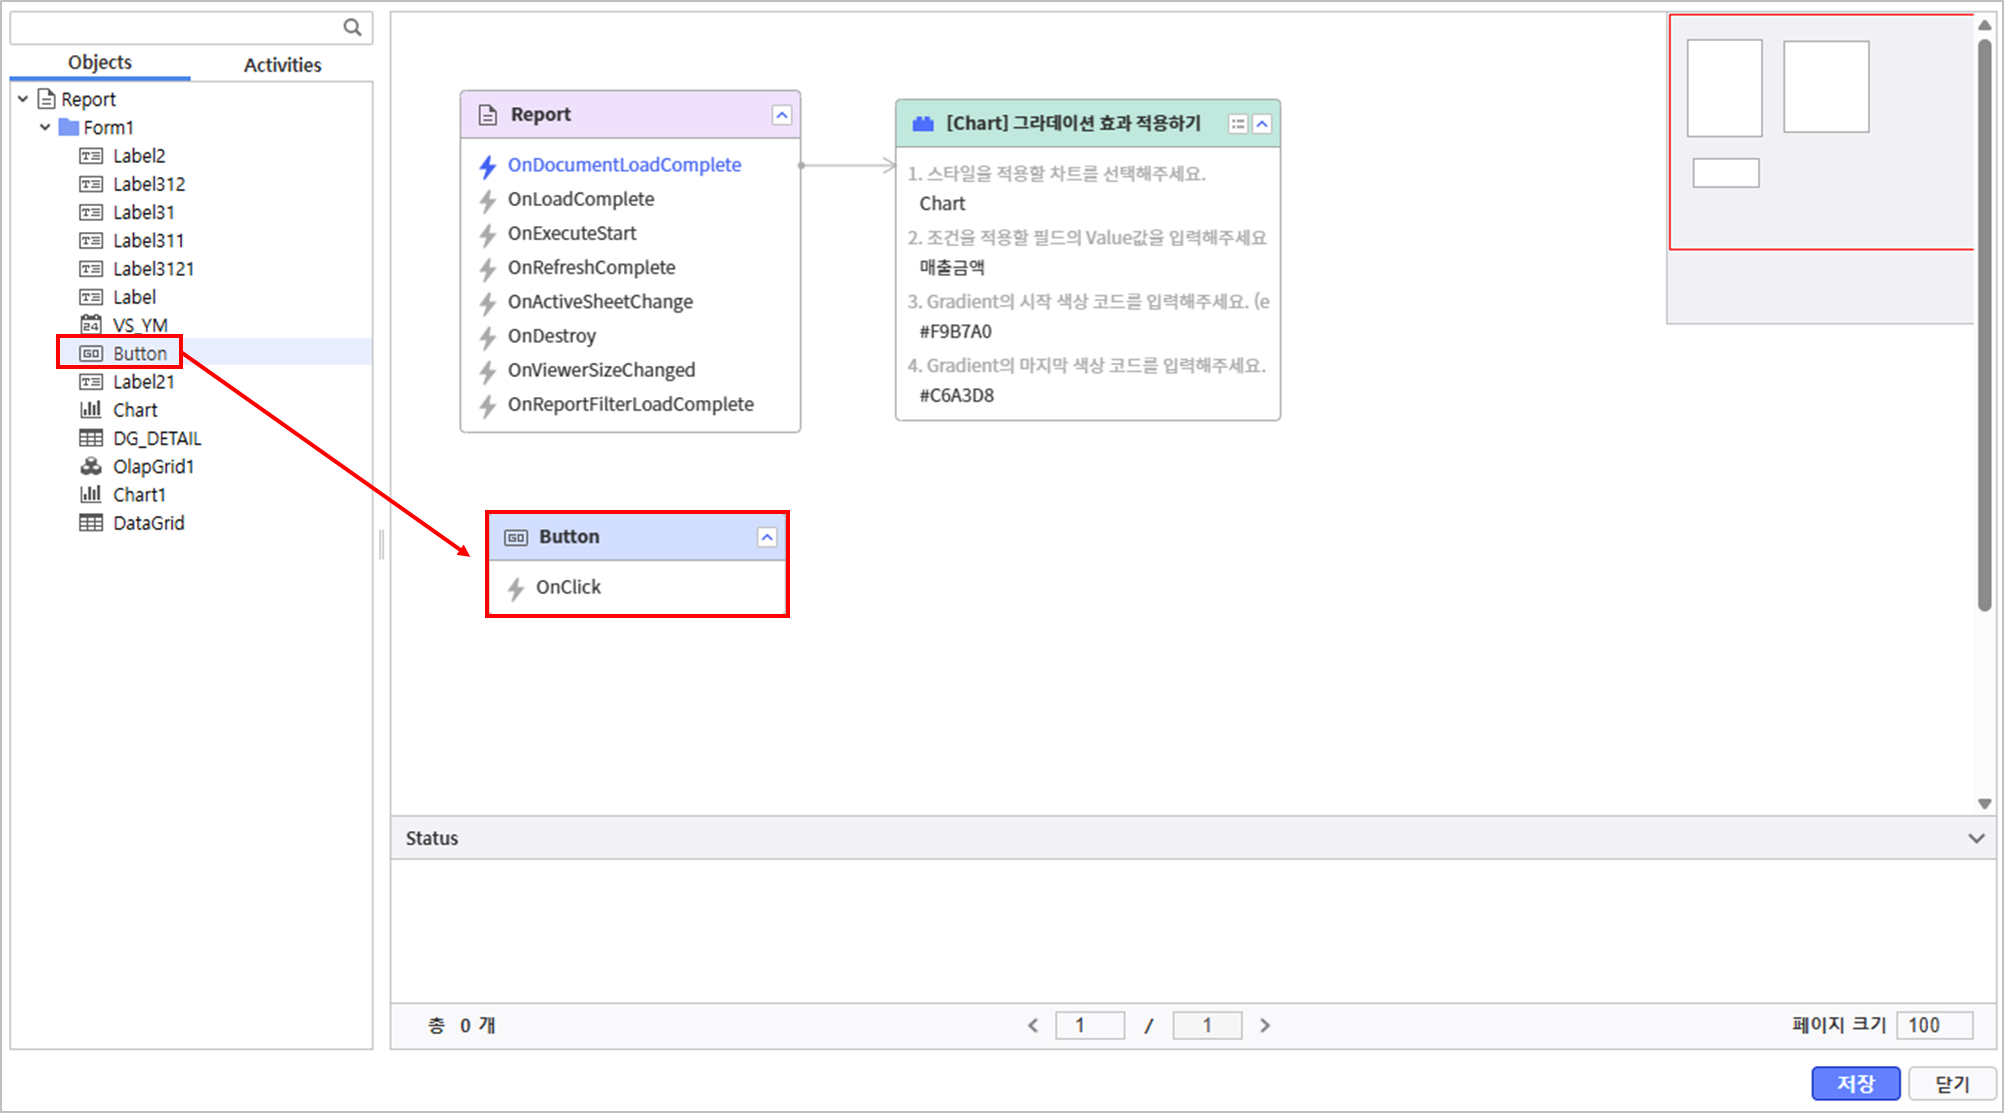
- Object 탭에서 Report를 더블 클릭해서 배치합니다In the Object tab, double-click and place the Report.

- Chart의 그라데이션 효과를 설정하는 모듈을 불러오고, Report의 OnDocumentLoadComplete 이벤트와 연결한 뒤
파라미터 설정을 위해 4번 아이콘을 클릭합니다.
모듈 이름 Load a module that sets the Chart gradient effect, connect with OnDocumentLoadComplete event of the Report,
and click Number 4 icon for parameter setting.- Module Name : "[Chart] 그라데이션 효과 적용하기Gradient Effect Application"

- 다음과 같이 모듈의 각 파라미터를 설정하고 저장 버튼을 누릅니다.
- 스타일 적용할 대상 차트 : Chart
- 조건을 적용할 필드의 Value : [매출금액] Gradient 시작 색상 코드 값Set the parameters of the module as below and Click Save button.
- Target Chart for Style Application : Chart
- Field Value to Apply Condition : [Sales Amount]
- Gradient Start Color Code : #F9B7A0
- Gradient 마지막 색상 코드 값End Color Code : #C6A3D8

4.2
...
Refresh for Query Button Module Setting
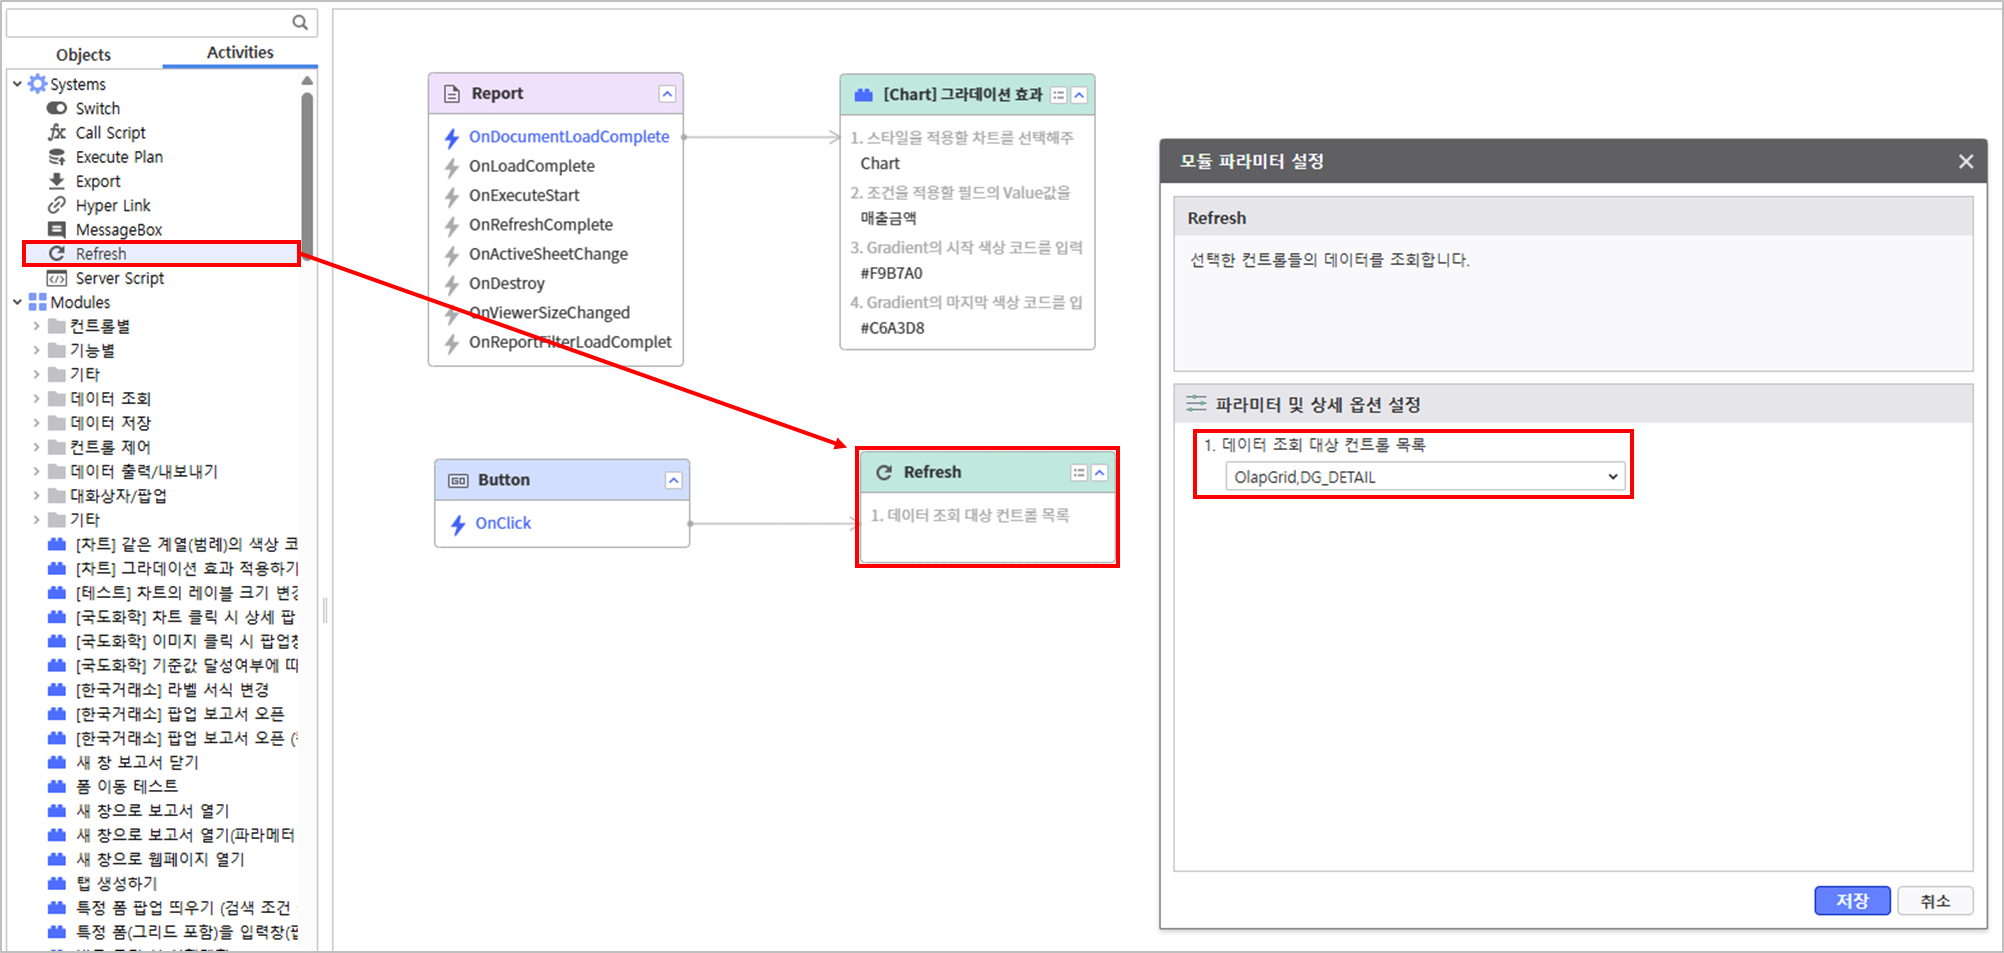
- Process Bot > Object 탭에서 Button을 선택하여 배치합니다.
- Activities 탭에서 시스템 모듈인 Refresh를 선택하여 Button의 OnClick 이벤트와 연결하고, 조회 대상 파라미터를 설정합니다.
조회 대상 컨트롤 목록 In the Activities tab, click system module, Refresh, connect with Button's OnClick event, and set query target parameter.- Query Target Control List : OlapGrid, DG_DETAIL
Step 5. Utilize the Script Editor
...
5.1
...
Writing a Variable Initializing Script
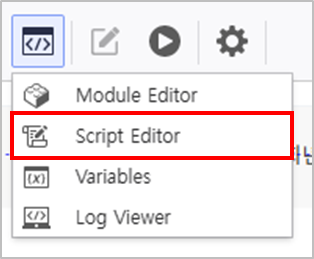
- In the report's top menu, click Edit Group > Script Editor를 클릭합니다.
- 사용할 API를 검색하여 더블 클릭합니다.
사용할 API Search and double-click an API to use.- API to Use : OnDocumentLoadComplete

변수 초기화를 위한 스크립트를 다음과 같이 작성합니다Write the following script to initialize a variable.
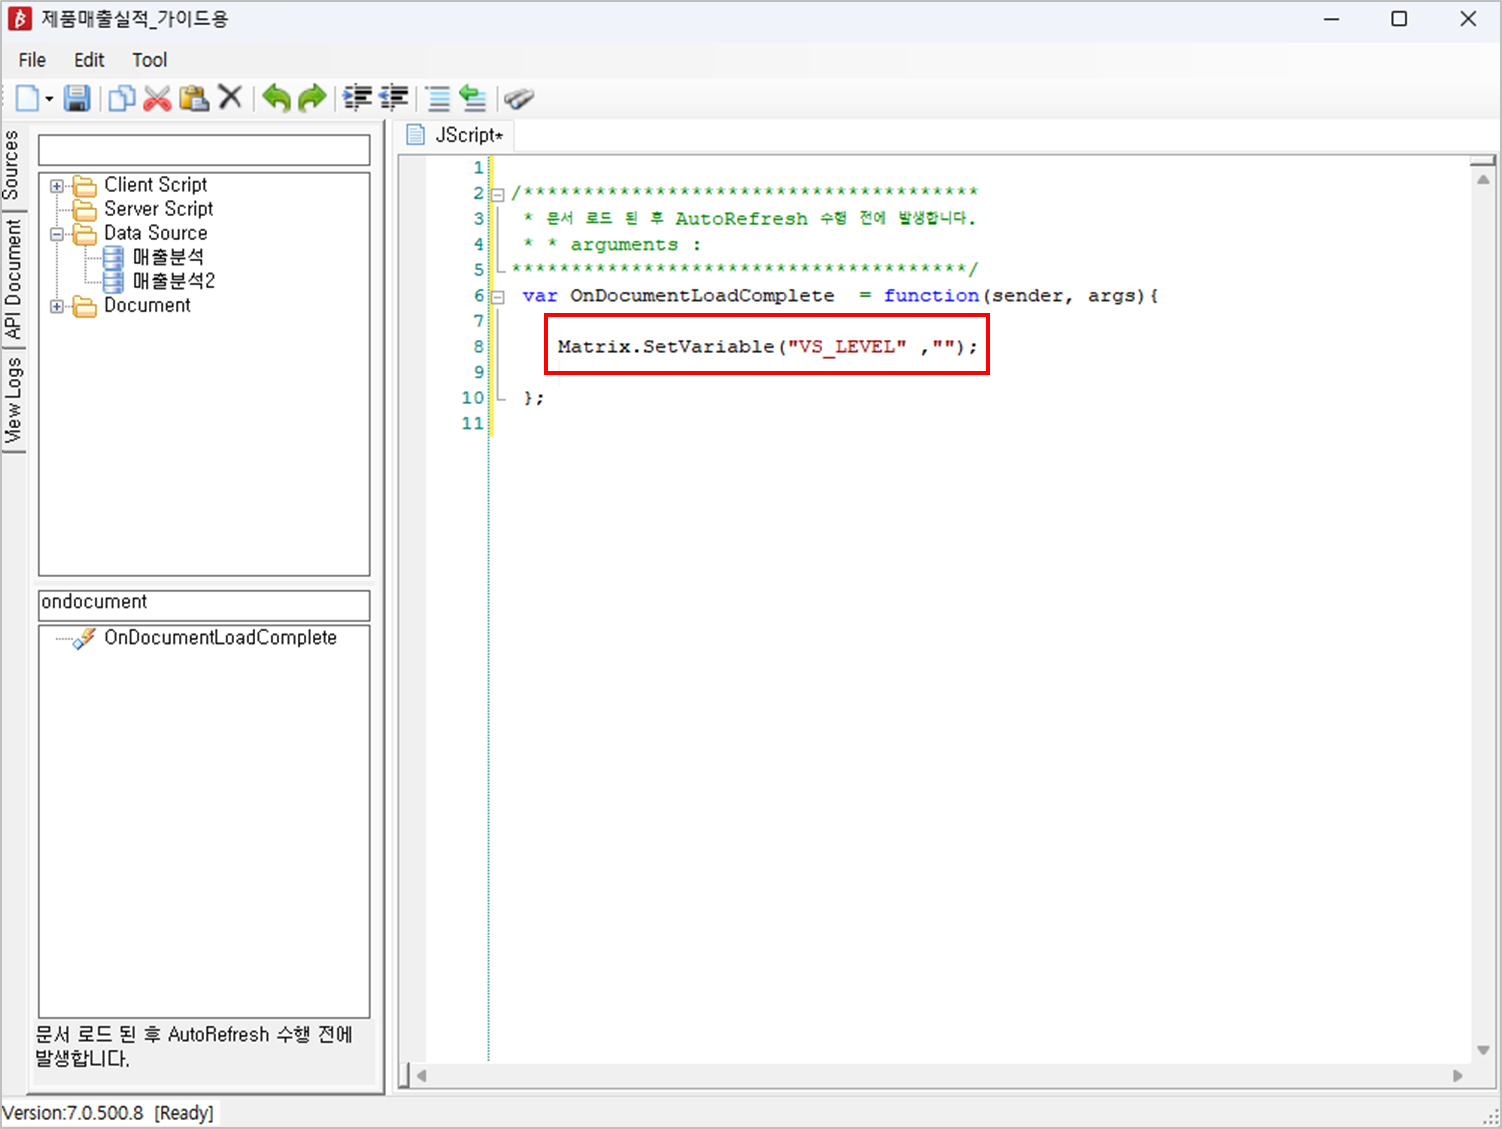
펼치기 title 작성한 스크립트Written Script Matrix.SetVariable("VS_LEVEL", "");
5.2
...
Write a Script to Refresh the DataGrid when a Chart is Clicked
- Search and double-click an API to use.

Chart 클릭 시에 발생할 이벤트에 대한 스크립트를 작성합니다Write a script for an event when the Chart is clicked.
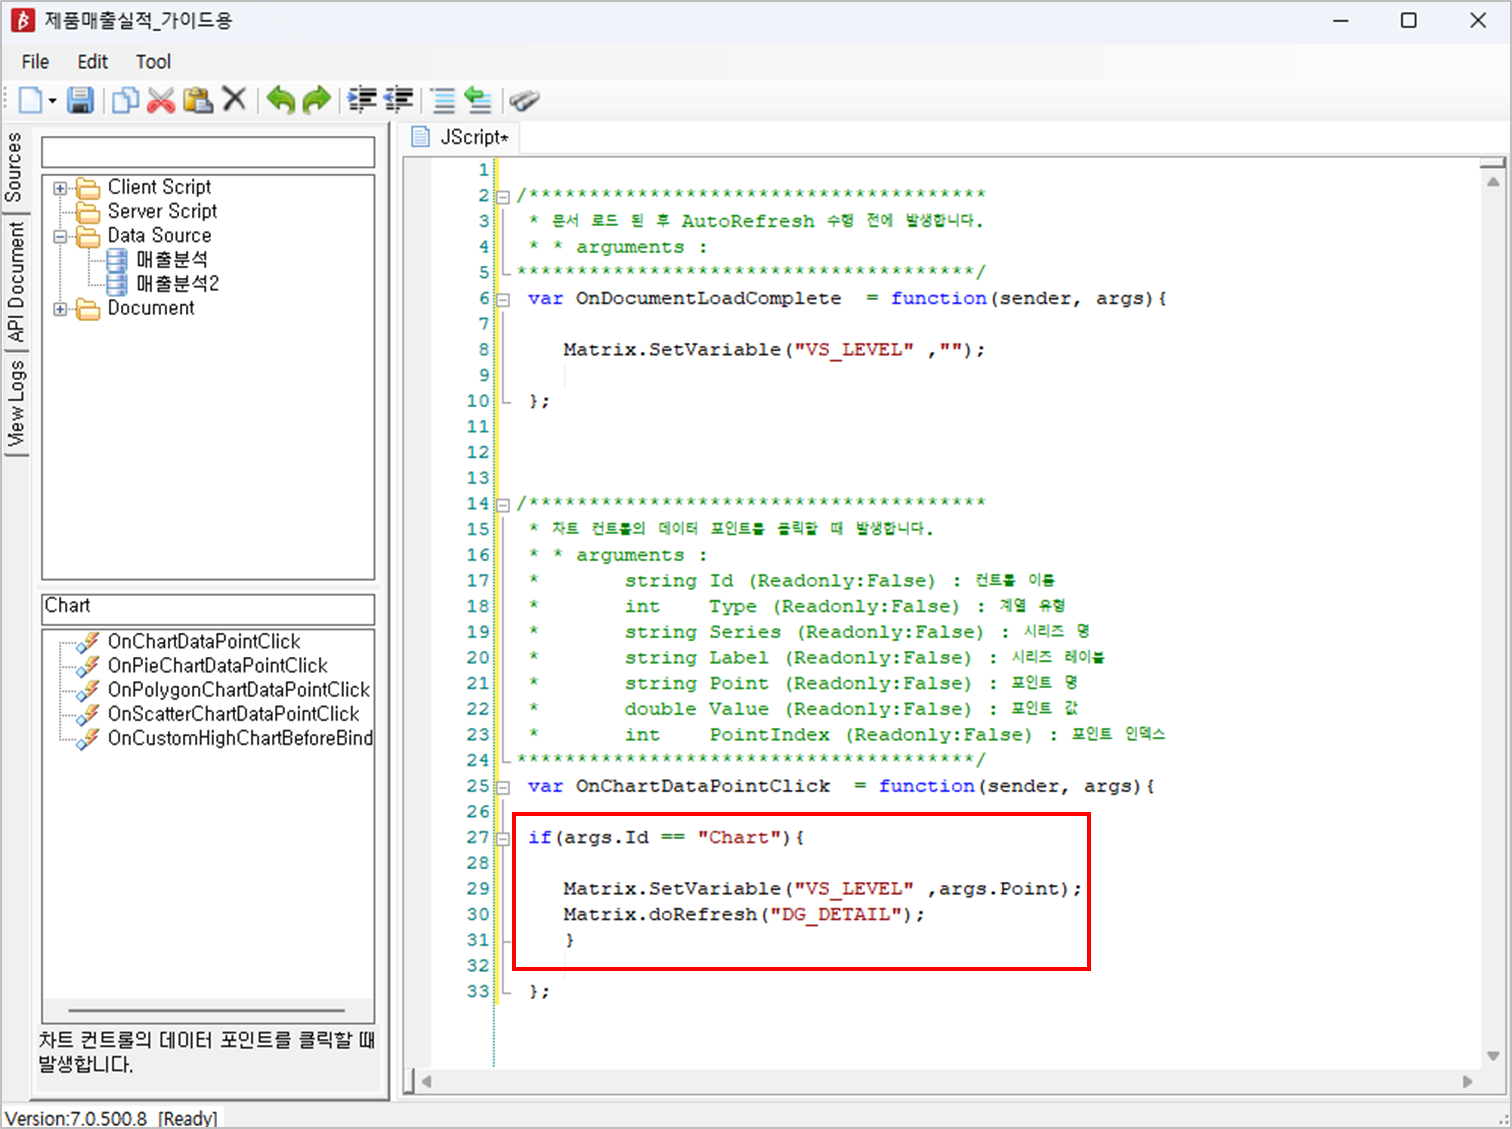
펼치기 title 작성한 스크립트Written Script if(args.Id == "Chart"){
Matrix.SetVariable("VS_LEVEL" ,args.Point);
Matrix.doRefresh("DG_DETAIL");
}
보고서가 정상적으로 동작하는지 확인합니다Verify that the report is working as expected.