| Target Screen |
|
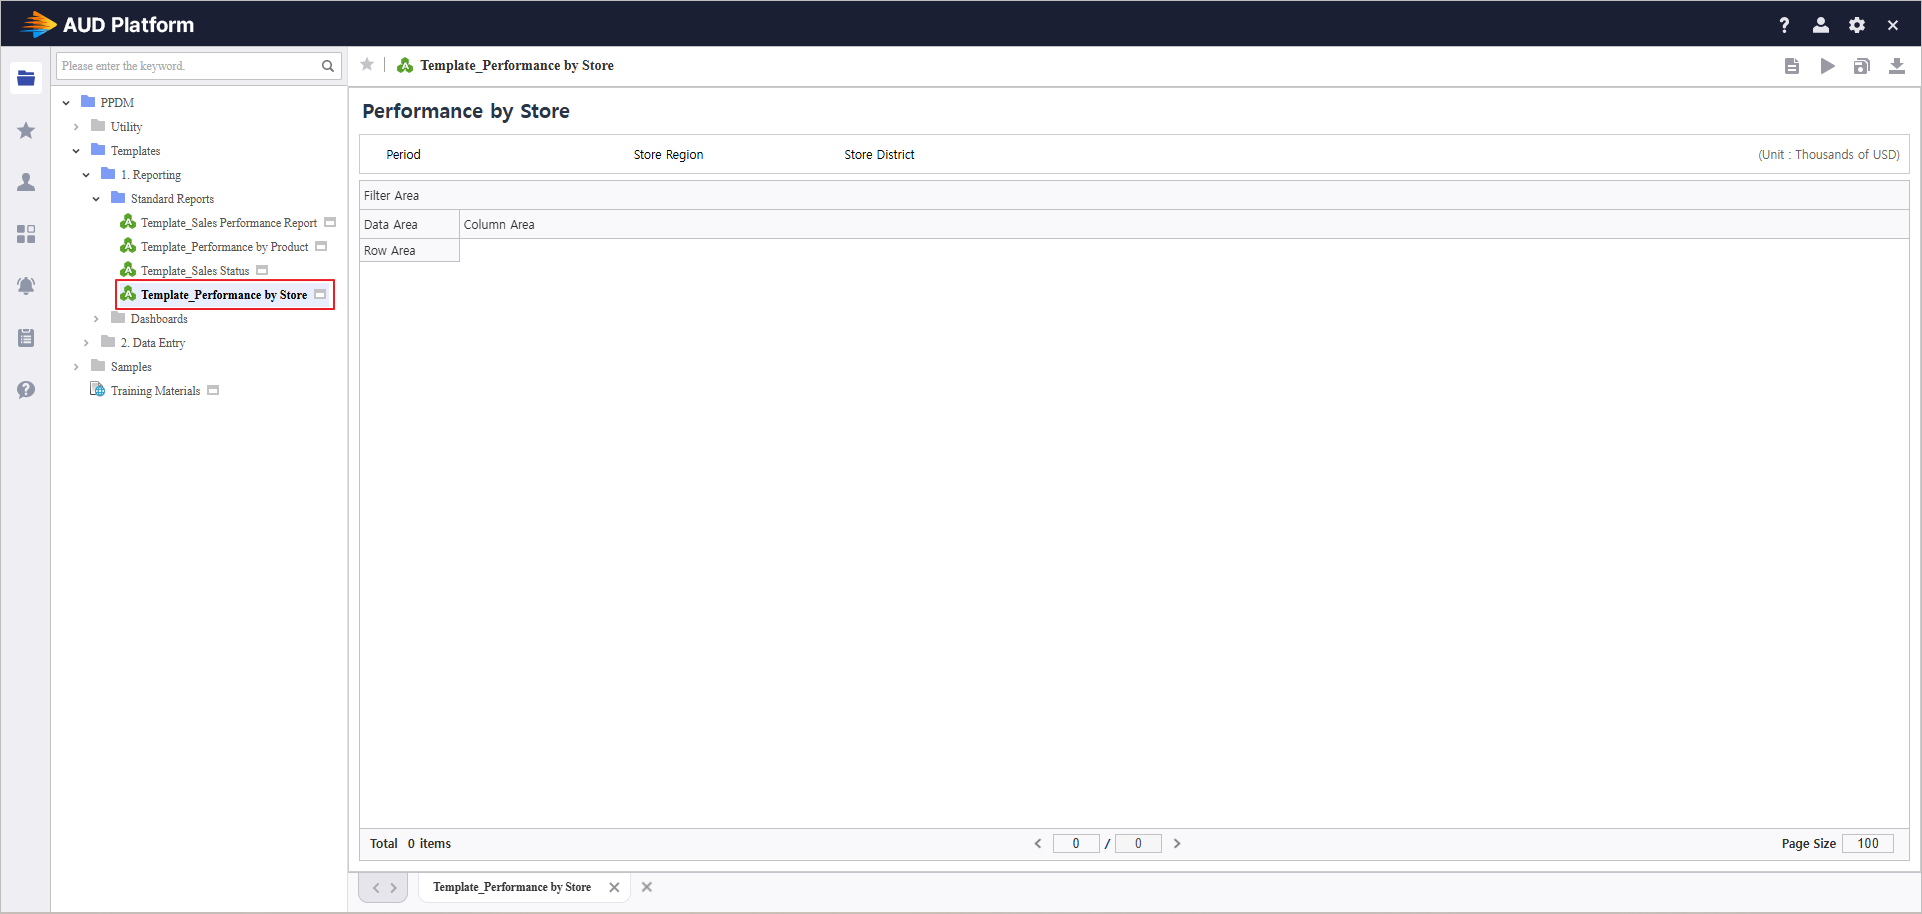
Template Report Information This practical session is conducted using a pre-configured template.
|
Step 1. Establish Data Connections
- Import data using i-META and SQL and bind them to the UI controls.
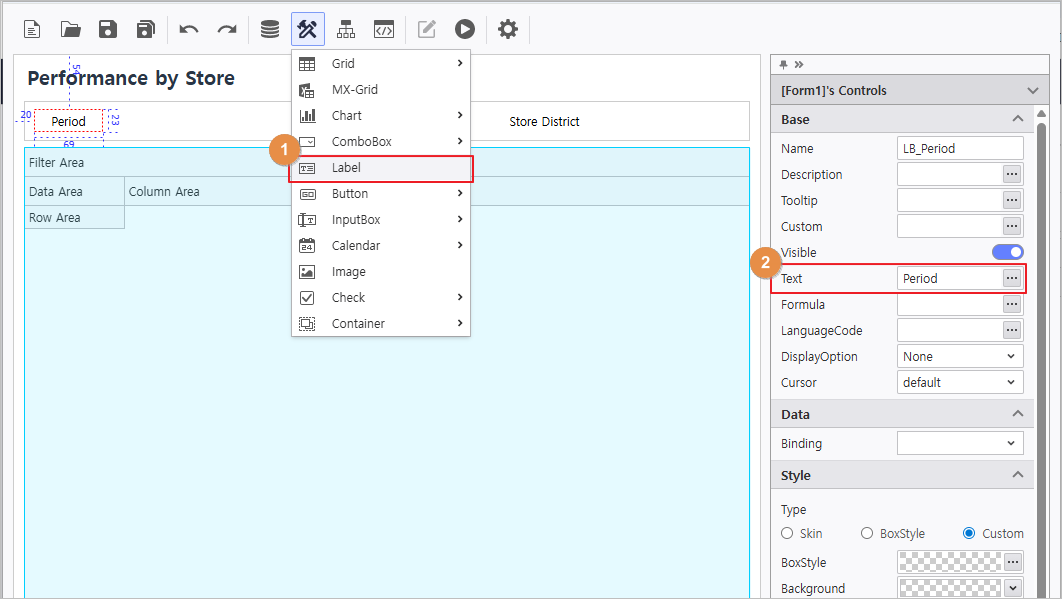
1.1 Inquiry Criteria Control Labels

Create components by selecting UI Bot > Label and modify their attributes.
Repeat this process to create title labels for each control.
Description
![]() (Note) Using the Docking Feature
(Note) Using the Docking Feature
By using the Docking attribute, a control remains fixed at a specific position based on its Margin values.
This ensures that controls maintain their designated positions even if the report window size changes.


(Example) To fix a control to the Right, set the Margin to 0,0,30,0 (Margin order: Left,Top, Right, Bottom)
1.2 Create Inquiry Controls
Label Text | Name | Control Type | DataSource Name | InitDate | i-META Query Condition Fields |
|---|---|---|---|---|---|
Period | VS_FROM, VS_TO | Calendar - M FromTo | - | DATE(-1,F,0);DATE(0,0,0) | YearMonth |
Store Region | VS_AREA | ComboBox - ComboBox | Region | <@ALL@> | Region |
Store District | VS_DISTRICT | ComboBox - ComboBox | District | <@ALL@> | SubRegion |
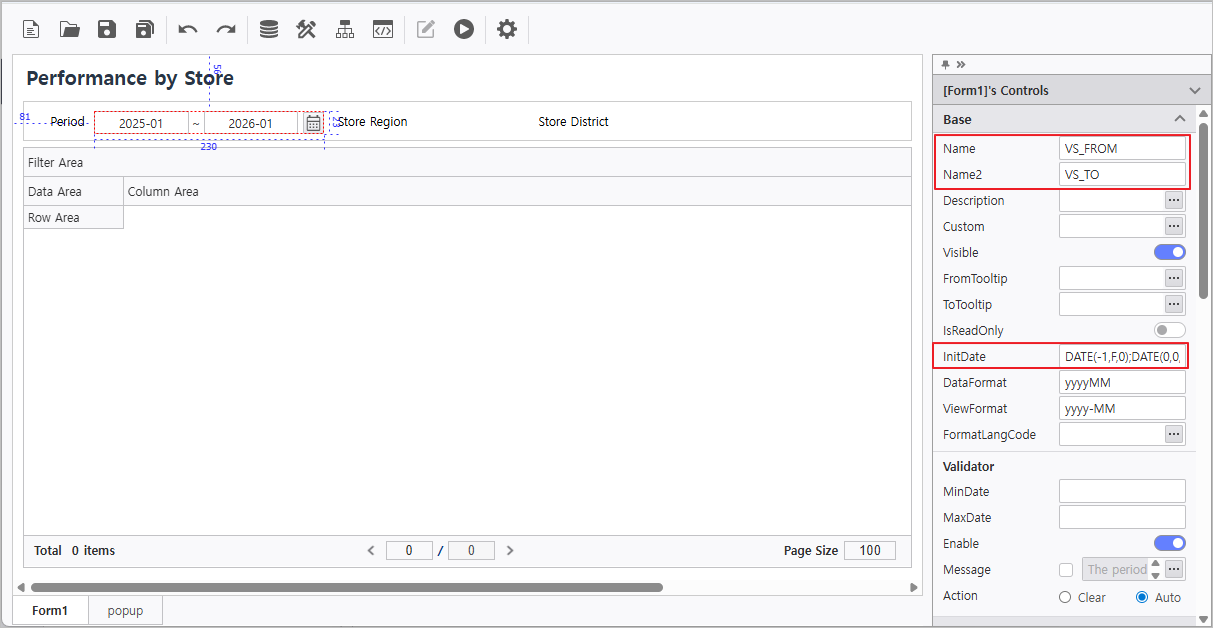
1. Period Calendar
- Select UI Bot > Calender > M FromTo to create the control.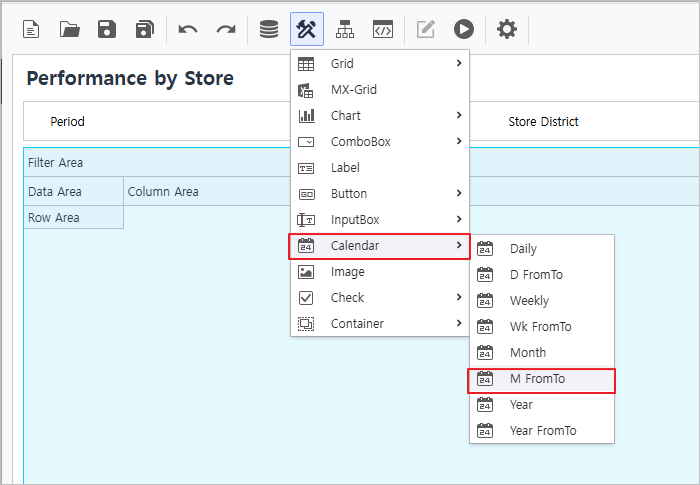
-Set the calendar's properties.
- Name : VS_FROM
- Name2 : VS_TO
- InitDate : DATE(-1,F,0);DATE(0,0,0)
Description
![]() InitDate Syntax
InitDate Syntax
Configure InitDate to set the default value of the calendar control.
![]() Numeric
Numeric
Enter in formats like 20230101 or 2023-01-01 .
![]() NOW Function
NOW Function
NOW() sets the value to the current date.
![]() DATE Function
DATE Function
DATE(0,0,0) = NOW()
The arguments within the function represent DATE(Year, Month, Day) respectively, and can be increased or decreased based on the current date.
Ex) To input a date one year prior to the current date
: DATE(-1,0,0)
![]() Reserved Keywords for DATE Function : F, L
Reserved Keywords for DATE Function : F, L
F(First) : Year 1900, January, 1st
L(Last) : Year 2999, December, The last day of the corresponding month (from 28th to 31st)
Ex) To input January 1st of the current year
: DATE(0,F,F)
To input the last day of the current month
: DATE(0,0,L)
![]() How to configure InitDate for FromTo Calendar
How to configure InitDate for FromTo Calendar
Separate the Start and End dates with a semicolon (;).
Ex) DATE(-1,0,0);NOW()
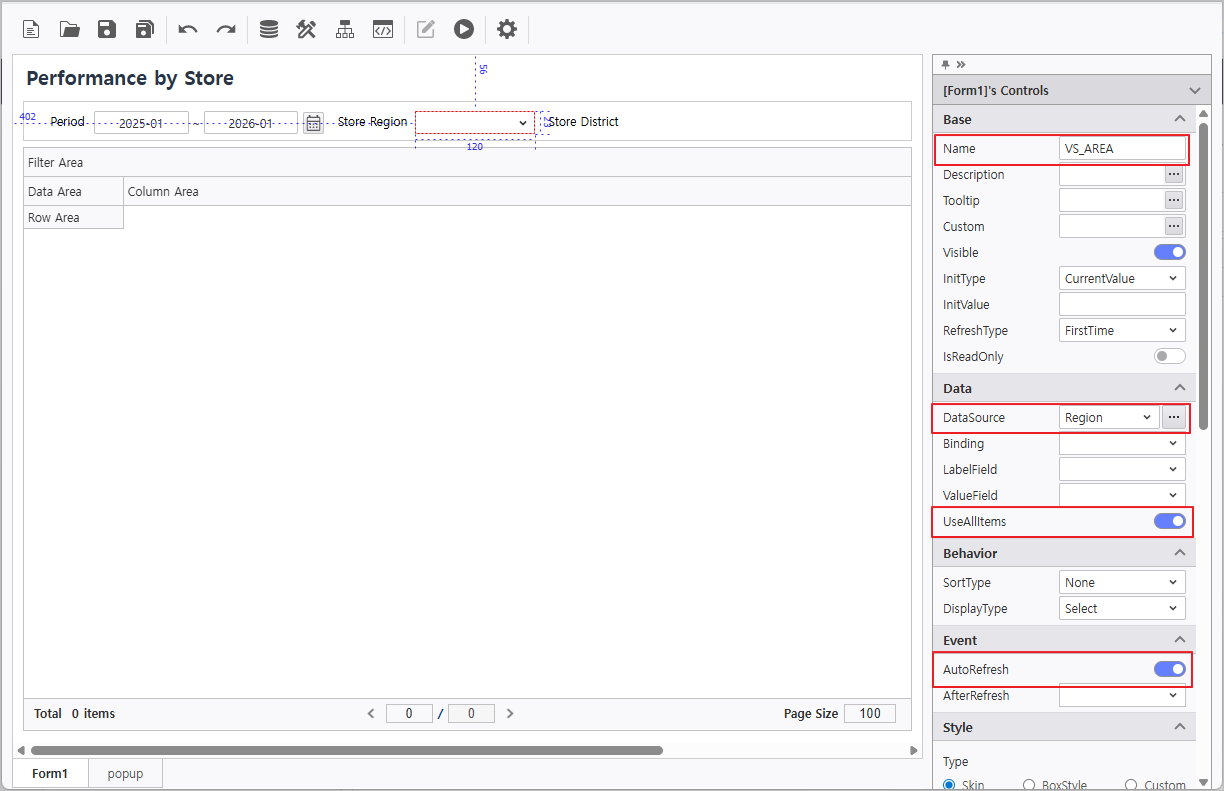
2. Region & District ComboBoxes
-Select UI Bot > ComboBox > Combo.

-Set the properties of Region combo box:
- Name : VS_AREA
- DataSource : Region
- Enable UseAllItems
- Enable AutoRefresh
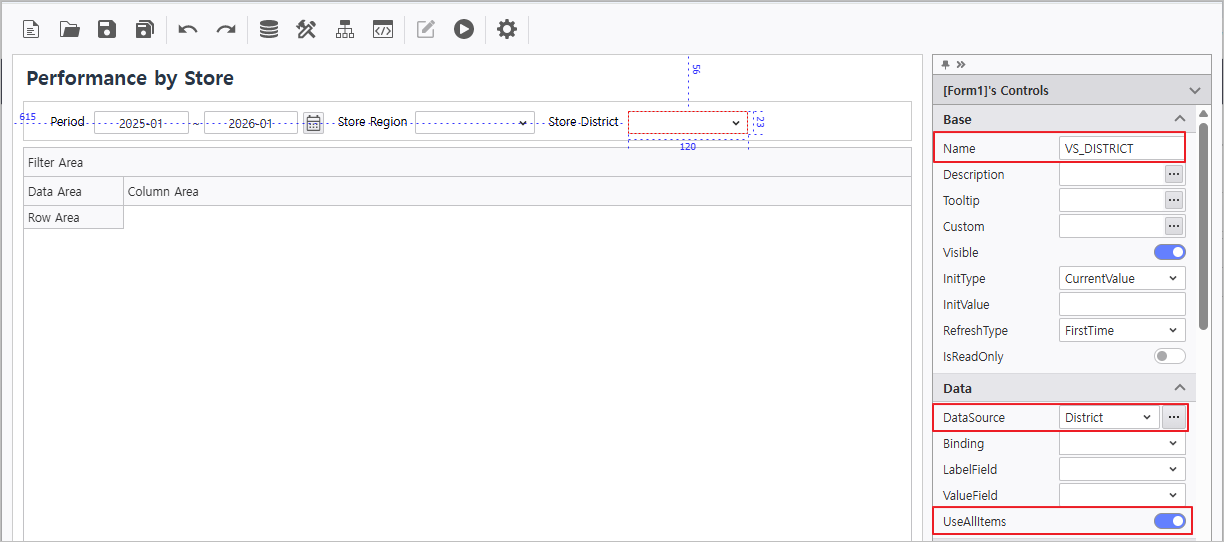
3. Set the properties of District combo box:
- Name : VS_DISTRICT
- DataSource : District
- Enable UseAllItems
 ㅅ
ㅅ
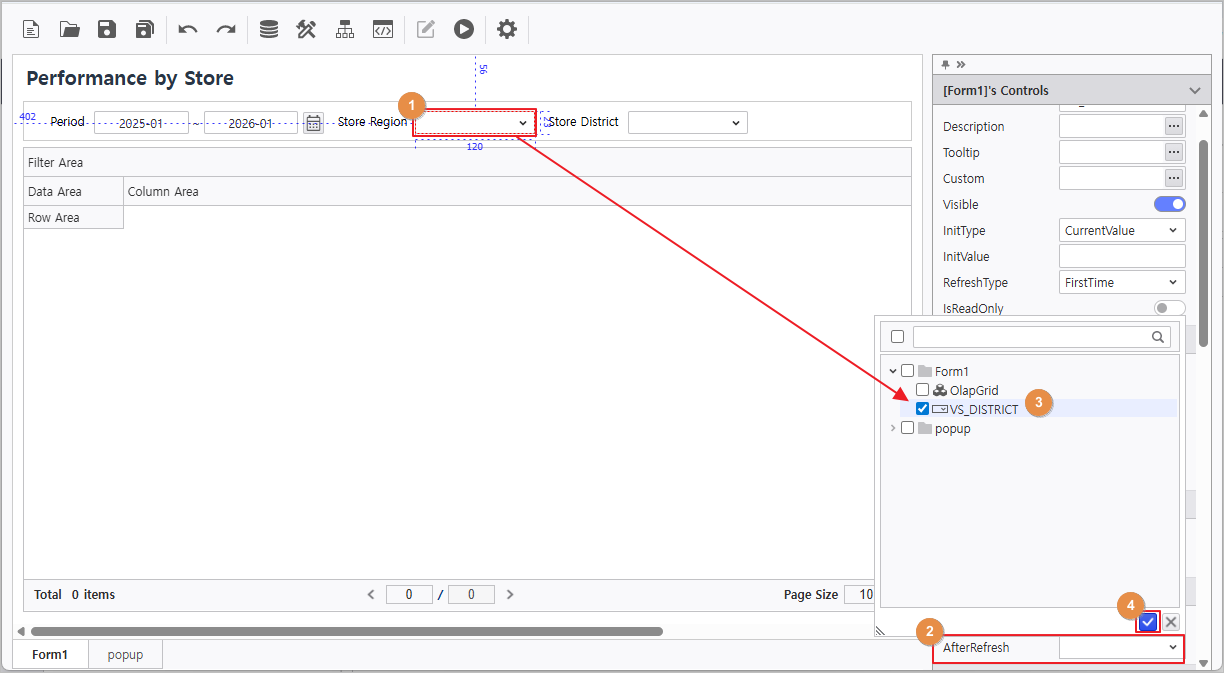
4. User the AfterRefresh feature so that selecting a Region updates the District list.
- Set AfterRefresh of Region combo box : Select VS_DISTRICT
1.3 Bind Olap-Grid Data
1. Deploy an Olap-Grid component.
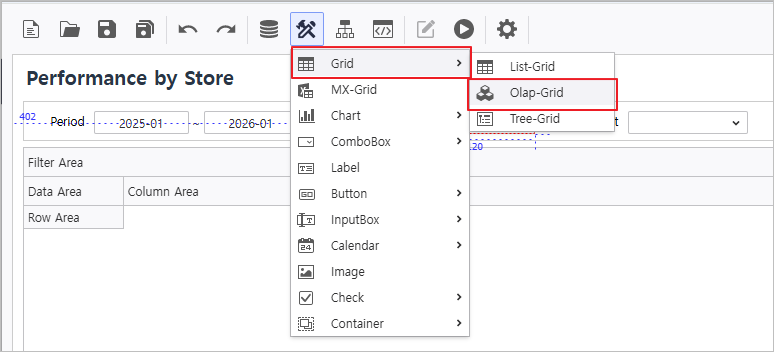
2. Right-click the grid and select DataSource > i-META to connect a datasource.
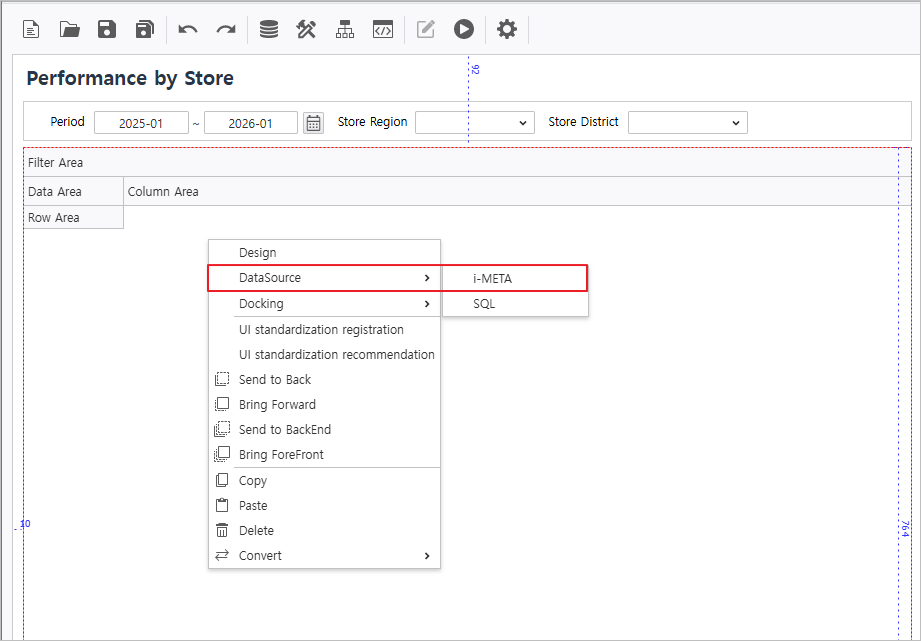
i-META File
- Path : Public Folder > PPDM > Samples > 3. i-META > Sales Analysis

- Drag & Drop fields and bind the inquiry parameters to the controls:
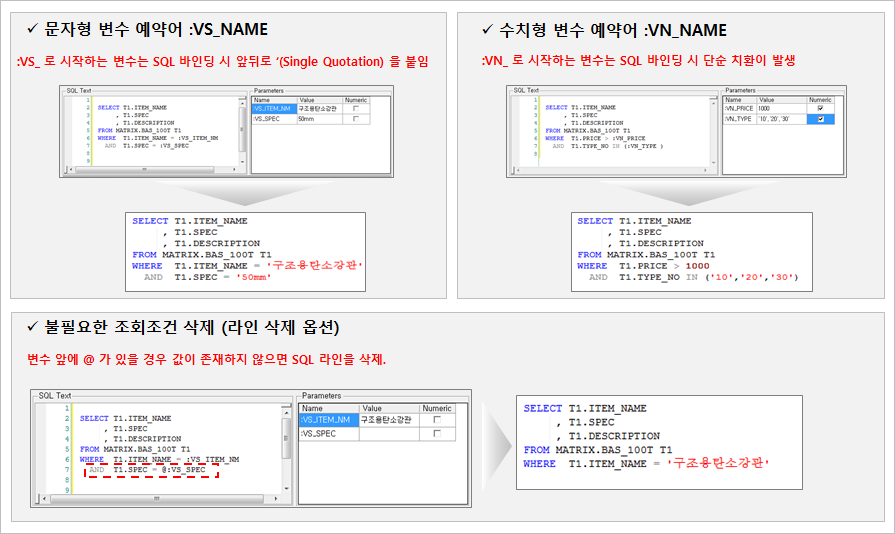
YearMonth BETWEEN :VS_FROM ~ :VS_TO
Region = @:VS_AREA
SubRegion = @:VS_DISTRICT

Discription
![]() SQL Variable Binding Rules
SQL Variable Binding Rules
Enable AutoRefresh in the Event settings.

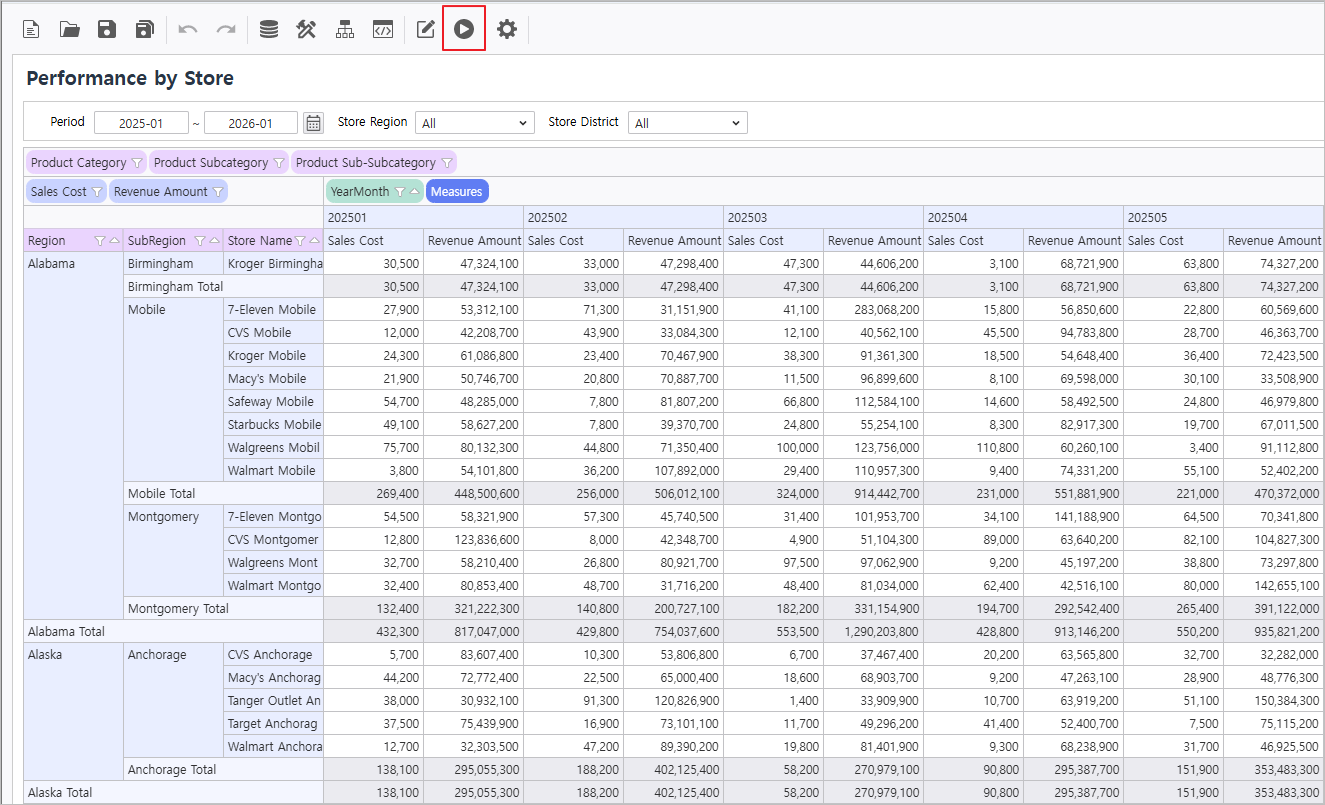
- Click [Execute] button to connect data to grid and verify the data inquiry.
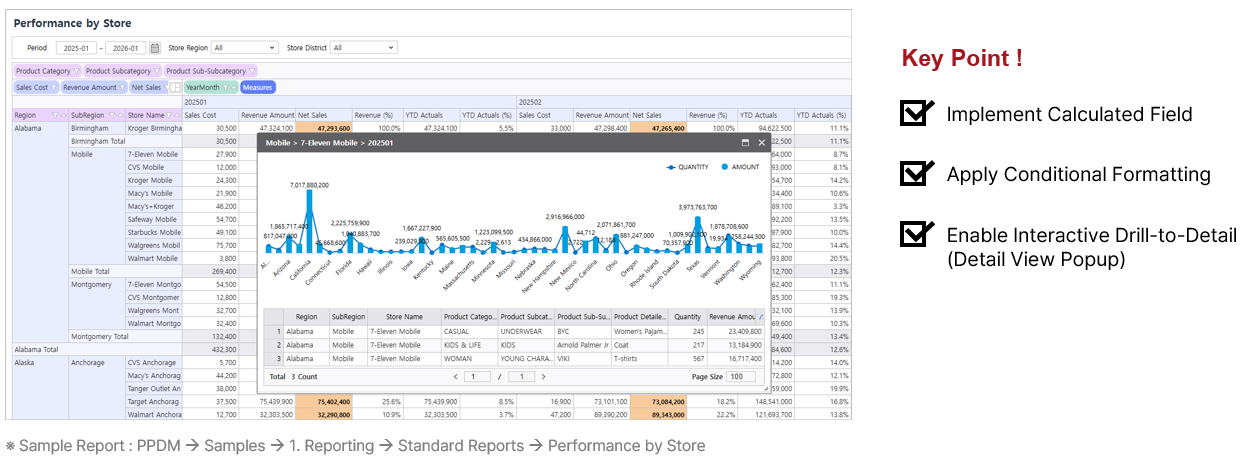
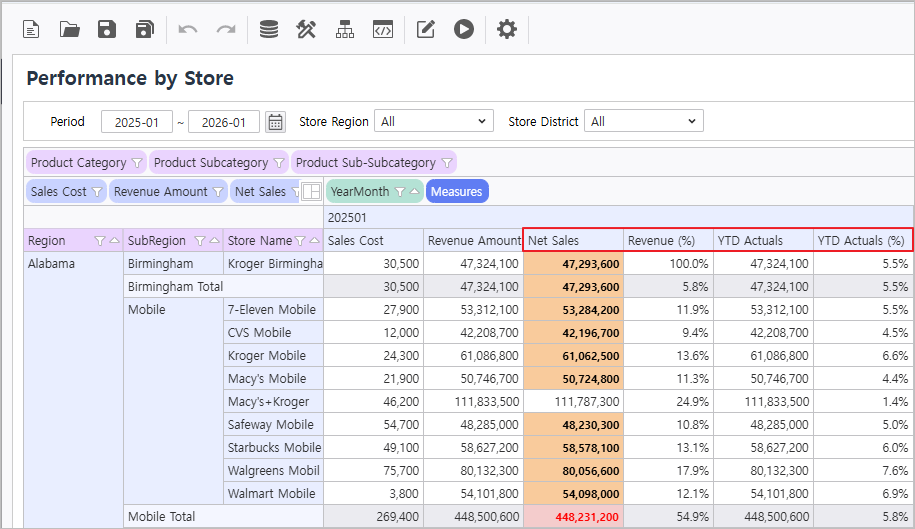
Step 2. Add Calculated Fields
1. Use OLAP formulas to add analytical metrics like Net Sales and Cumulative Performance.
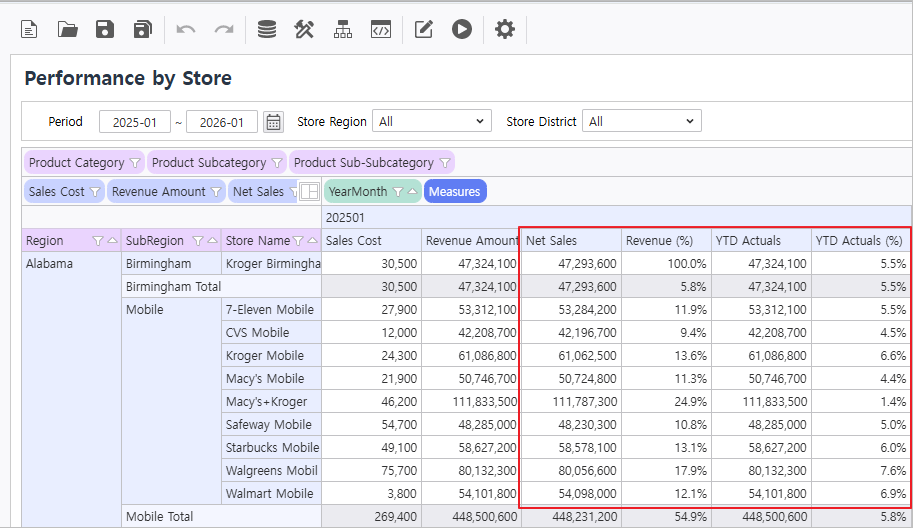
Calculated fields to add: Net Sales, Revenue(%), YTD Actuals, YTD Actuals(%)
| Caption | Secondary Calc. | Format | Formula |
|---|---|---|---|
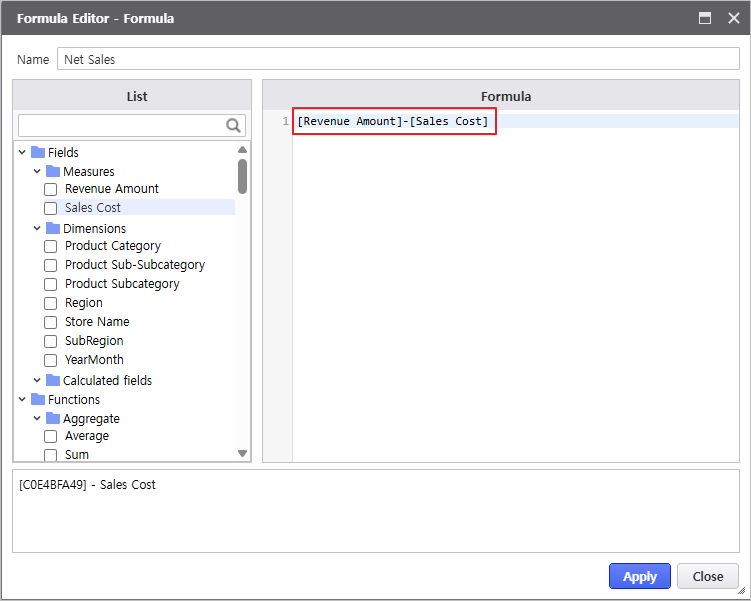
| Net Sales | None | {0:N0} | [Revenue Amount]-[Sales Cost] |
| Revenue(%) | Type - SubTotalPercentOfRow | {0:N1}% | [Revenue Amount] |
| YTD Actuals | Type - RunningSum | {0:N0} | [Revenue Amount] |
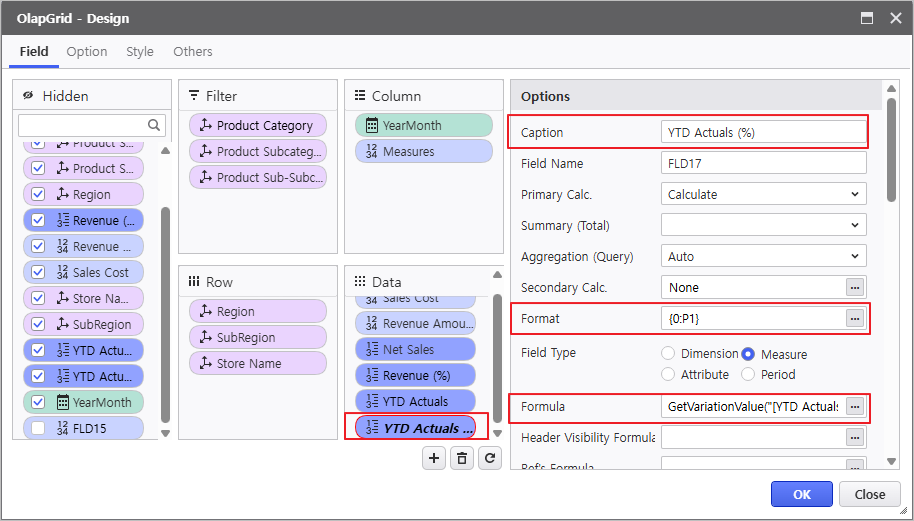
| YTD Actuals(%) | None | Percent : {0:P1} | GetVariationValue("[YTD Actuals]", false) / ForAll("[YearMonth]", "[Revenue Amount]", true) |
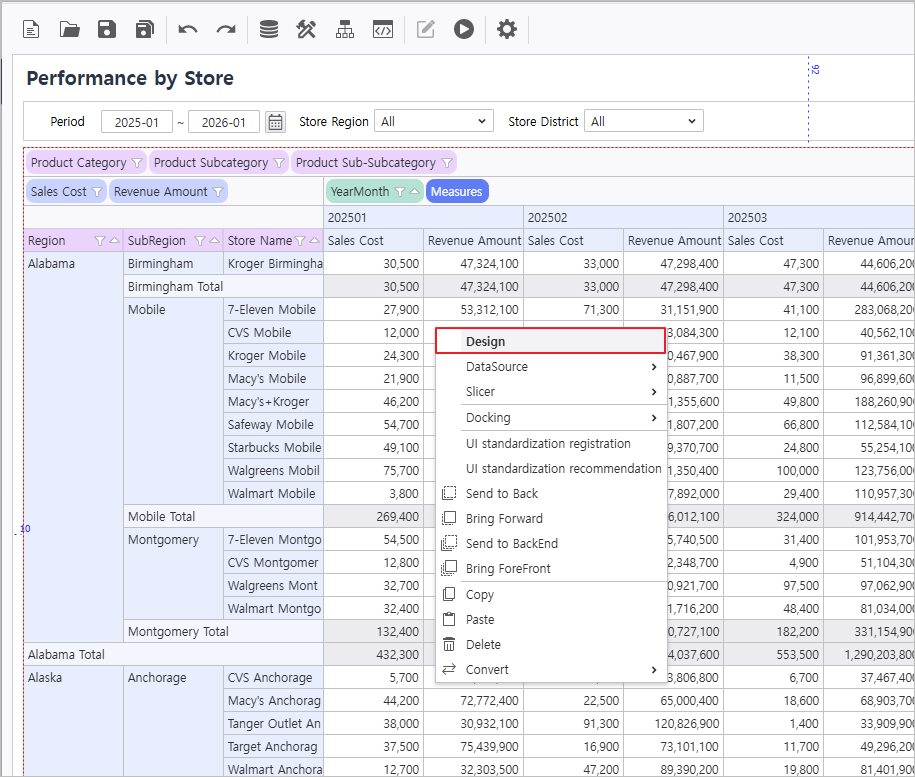
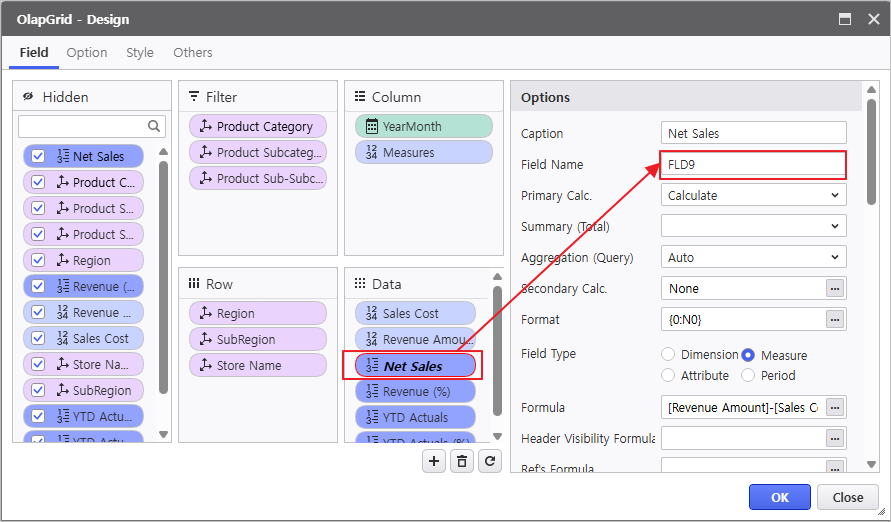
2. Right-click the grid and navigate to Design > Field to create a calculated field.
Add Fields
- Click the ![]() button to add a field.
button to add a field.
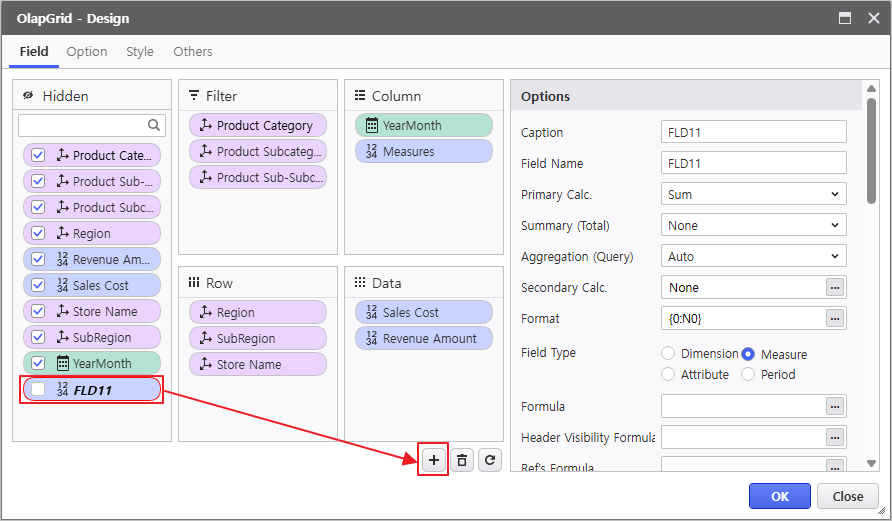
- Checking the box next to the generated field name moves it to the Data area.
Caption : Net Sales
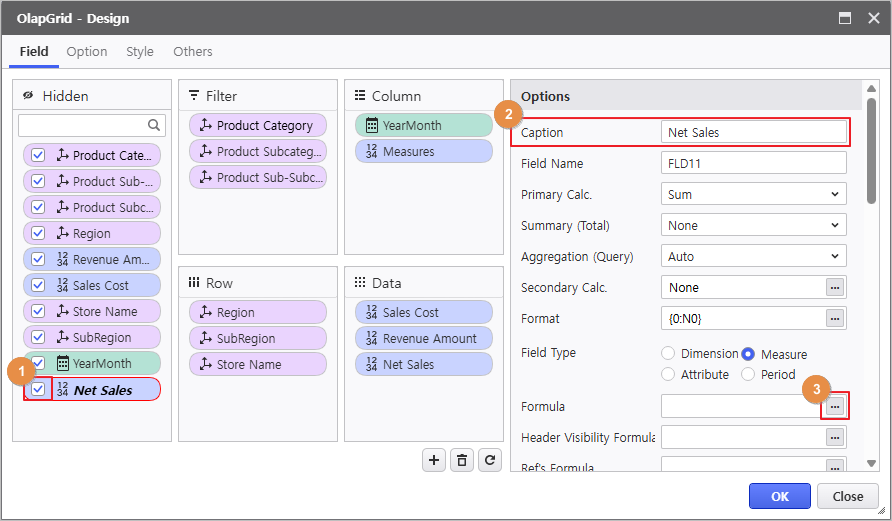
- Click the Formula ![]() button to open the Formula Editor window and enter the expression: [Revenue]-[Sales Cost].
button to open the Formula Editor window and enter the expression: [Revenue]-[Sales Cost].
(![]() The formula editor is case and space sensitive; it is recommended to select items from the List on the left for accuracy.)
The formula editor is case and space sensitive; it is recommended to select items from the List on the left for accuracy.)
- Enter the following for the Revenue(%) calculated field:
Caption: Revenue(%)
Secondary Calc: SubTotalPercentOfRow
Format: {0:N1}%
Formula: [Revenue Amount]

2. Enter the following for the YTD Actuals calculated field:
Caption: YTD Actuals
Secondary Calc: RunningSum, Field: YearMonth
Formula: [Revenue Amount]


3. Enter the following for the YTD Actuals(%) calculated field:
Caption: YTD Actuals(%)
Format: {0:P1}
Formula: GetVariationValue("[YTD Actuals]", false)/ForAll("[YearMonth]", "[Revenue]", true)
Description
![]() Description of Used Functions
Description of Used Functions
Click a function in the list to view its description.
-GetVariationValue
Returns the secondary calculation value for a specific measure in the cell.
* object GetVariationValue("[FIELD]")
-ForAll
A function that controls the layout, allowing access to grand totals by removing items defined in Dimensions based on the current layout.
Mostly used for percentage calculations.
The NoFilter argument defaults to false, determining whether to calculate based on filter information from all fields.
Operates similarly to SQL's Group BY functionality.
* object ForAll("[Dimension 1];[Dimension 2]", "[Measure]", NoFilter)
4. Click the Execute button to verify that the configured calculated fields are applied correctly.
Step 3. Create Custom Items
- You can add analytical items using the Custom Items feature.
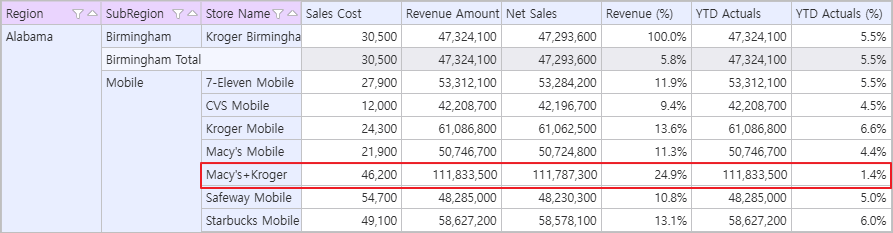
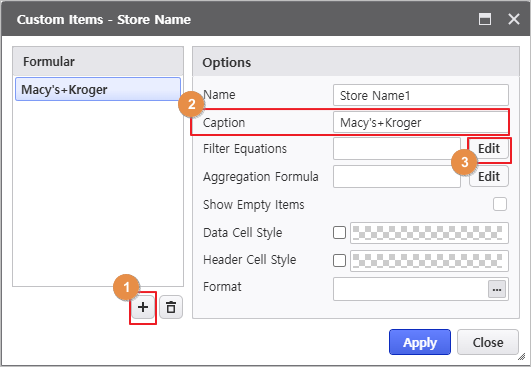
1. Right-click the [Store Name] field and select [Custom Items].

- Click the Add ![]() button and enter the caption.
button and enter the caption.
- Caption : 강릉라푸마+강릉종합매장
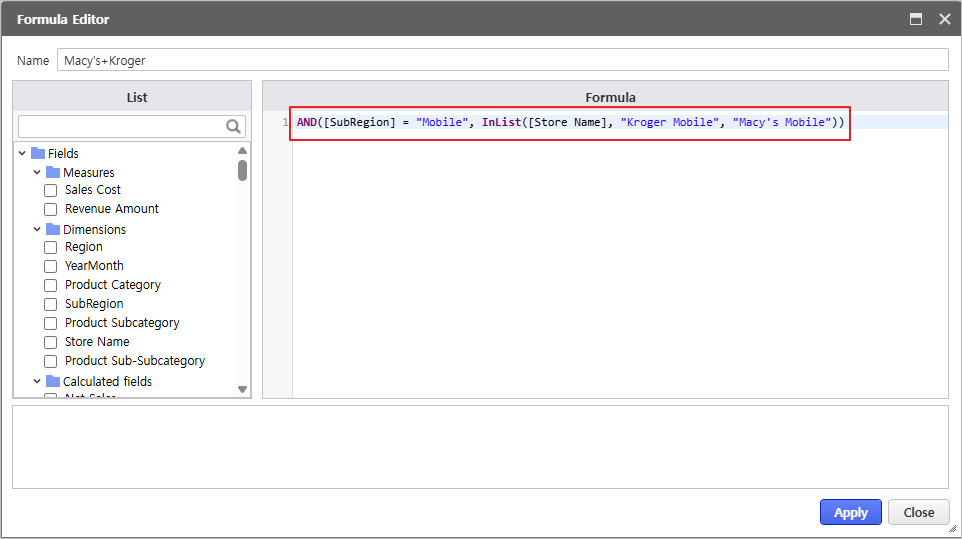
- Click the [Edit] button for the Filter Equations to launch the Formula Editor.
- Compose the expression in the formula input window.
- AND([SubRegion] = "Mobile", InList([Store Name], "Kroger Mobile", "Macy's Mobile"))
Description
![]() Description of Used Functions
Description of Used Functions
Click a function in the list to view its description.
-AND
Returns the logical product of n passed parameters.
* bool AND(bool condition1, bool condition2, ...)
-InList
Returns whether the value of the target field exists within the list of comparison values.
* bool InList([FIELD_NAME], "value1","value2", ...)
Step 4. Configure Conditional Formatting
Use the Conditional Formatting feature to specify styles based on conditions.
Condition Basis : Dynamically changes conditions based on the displayed data values.
- Right-click the grid and navigate to the Design menu.
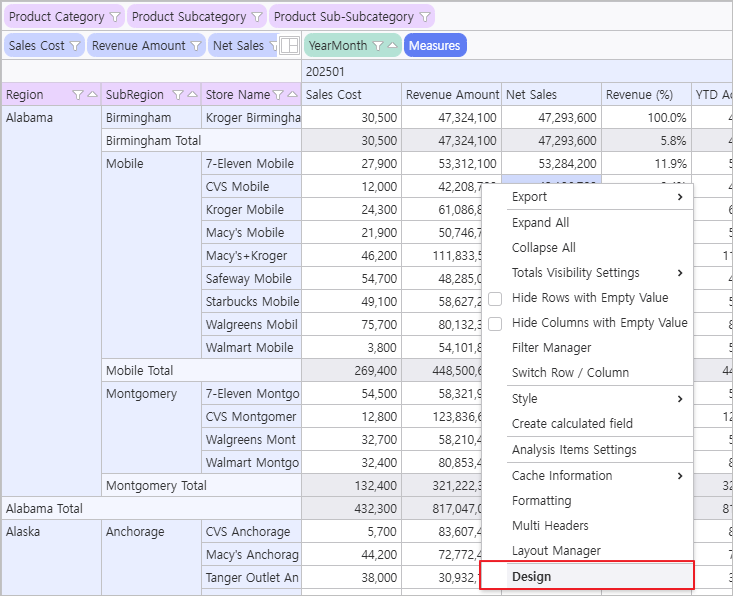
- Copy the field name to be used as the condition target.
- In the [Style] tab, click the ![]() button for Conditional Formatting to launch the Formula Editor.
button for Conditional Formatting to launch the Formula Editor.
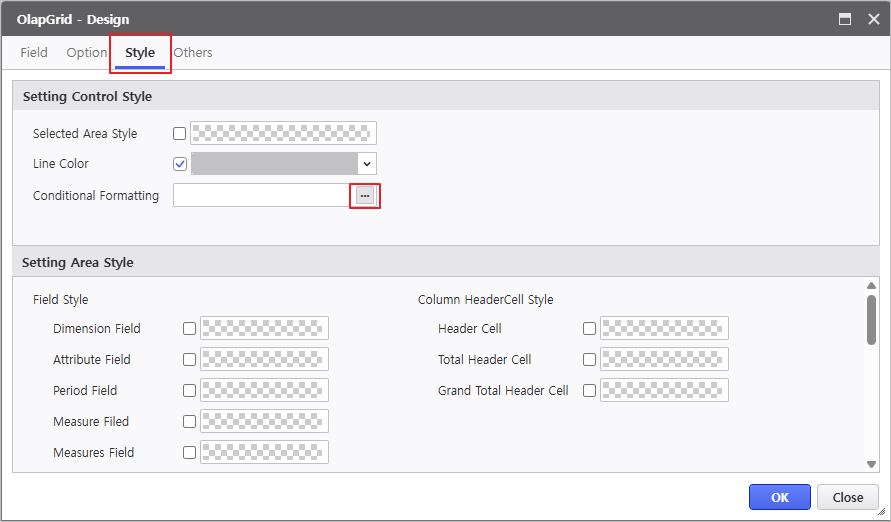
- Compose the formula according to the conditions and click the [Apply] button to input it.
(![]() Search for styles by name in the List, and copy the field name as shown below. )
Search for styles by name in the List, and copy the field name as shown below. )
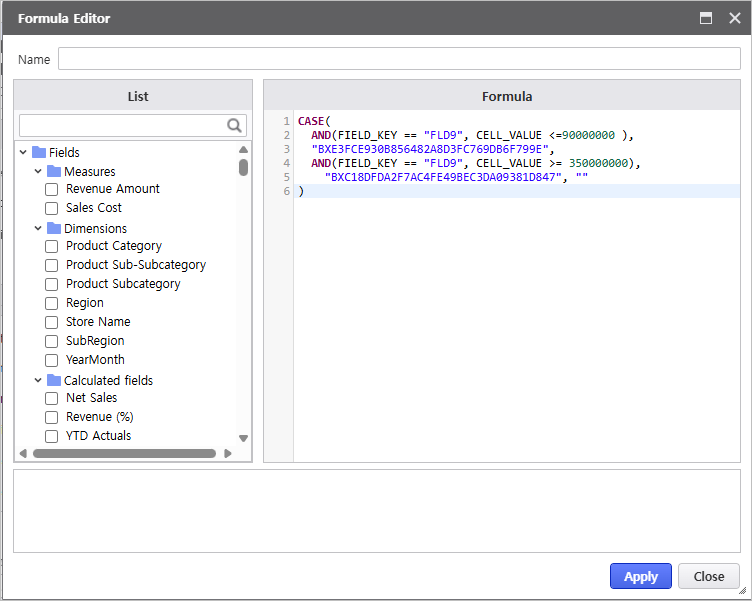
Check Detailed Formula
CASE(
AND(FIELD_KEY == "FLD9", CELL_VALUE <=90000000 ),
"BXE3FCE930B856482A8D3FC769DB6F799E",
AND(FIELD_KEY == "FLD9", CELL_VALUE >= 350000000),
"BXC18DFDA2F7AC4FE49BEC3DA09381D847", ""
)
Description
![]() Description of Used Functions
Description of Used Functions
Click a function in the list to view its description.
-CASE(Search as SWITCH)
Sequentially checks n condtions and returns the value of the first true condition.
If all conditions are false, the final default value is returned.
* object Switch(bool condition1, object value1 , bool condition2, object value2 , bool conditionX, object valueX , object elseValue)
-AND
Returns the logical product of n passed parameters.
* bool AND(bool condition1, bool condition2, ...)
Step 5. Configure Drill To Detail
Configure the Variable Editor and Process Bot so that double-clicking a data cell in the Olap-Grid triggers a popup to view detailed records.
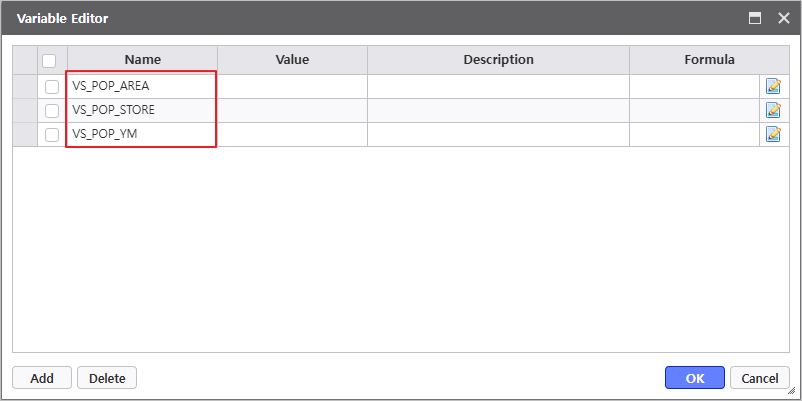
5.1 Variable Editor
Manage report parameters in the Variable Editor.
(Variables are pre-registered in the template.)
Editor Group > Variables

5.2 Configure Persistence Actions Using Process Bot
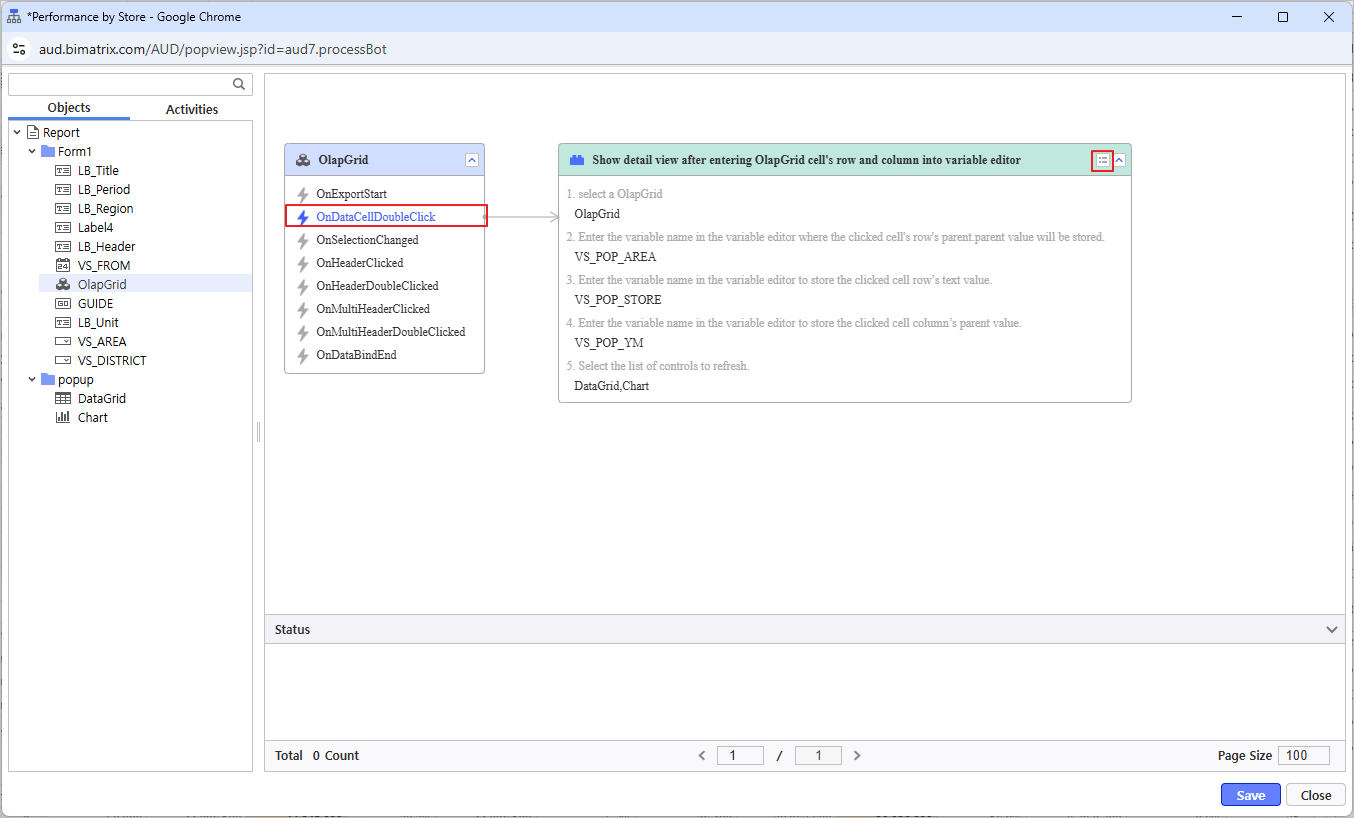
Use Process Bot to set the POPUP form to display as a detail view when an OlapGrid cell is double-clicked.
- Click the Process Bot icon(![]() ) to launch the Process Bot window and double-click the OlapGrid control.
) to launch the Process Bot window and double-click the OlapGrid control.
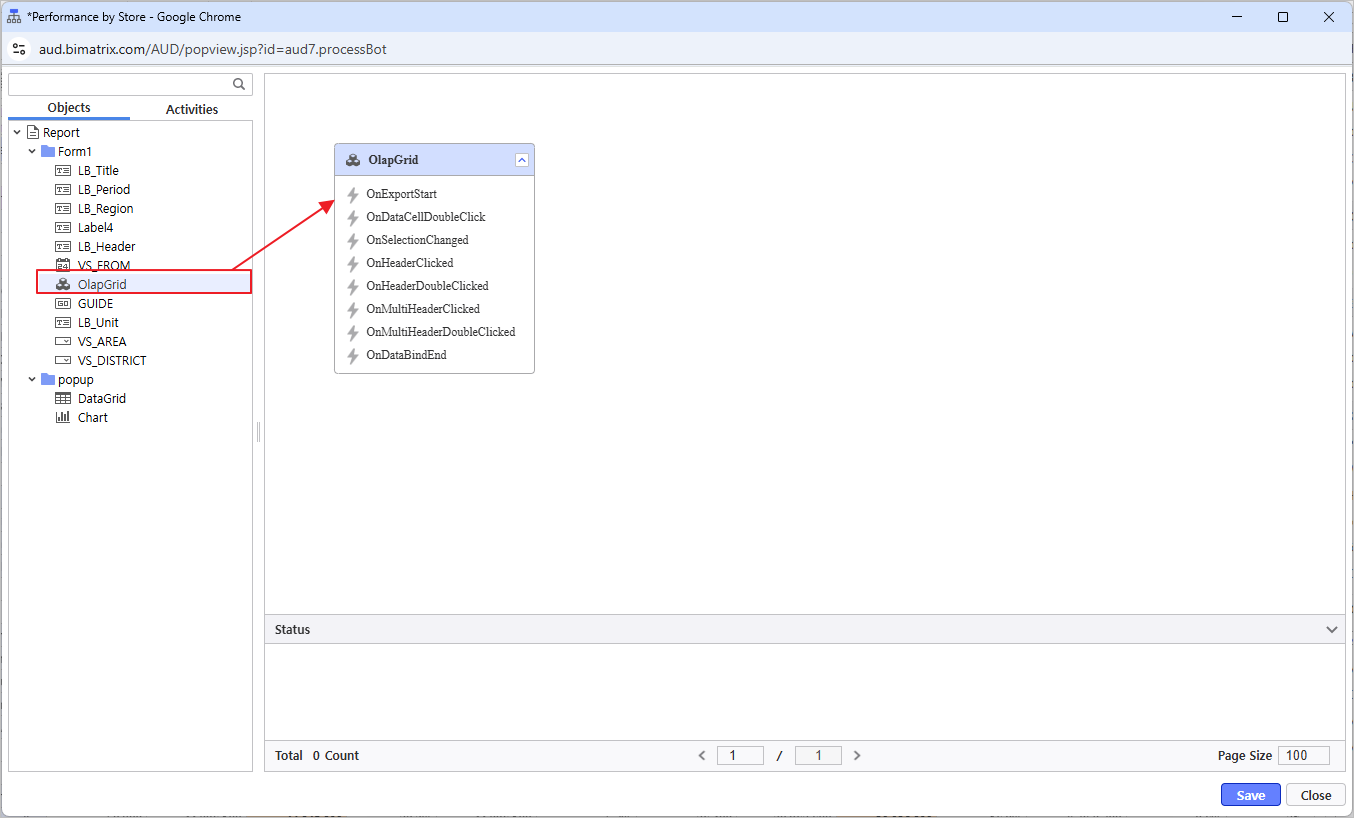
- From the Activities tab, search for "Detail" and deploy the module: 'Show detail view after entering OlapGrid cell's row and column Into variable editor'..

Click the Module Parameter icon(![]() ) to configure the 'Show detail view after entering OlapGrid cell's row and column into variable editor' action.
) to configure the 'Show detail view after entering OlapGrid cell's row and column into variable editor' action.
Save after linking with the OlapGrid's OnDataCellDoubleClick event. Input the option values as follows so that the District, Store Name, YearMonth of the clicked cell are entered into the Variable Editor.
-VS_POP_AREA
-VS_POP_STORE
-VS_POP_YM
5.3 Popup Screen Configuration
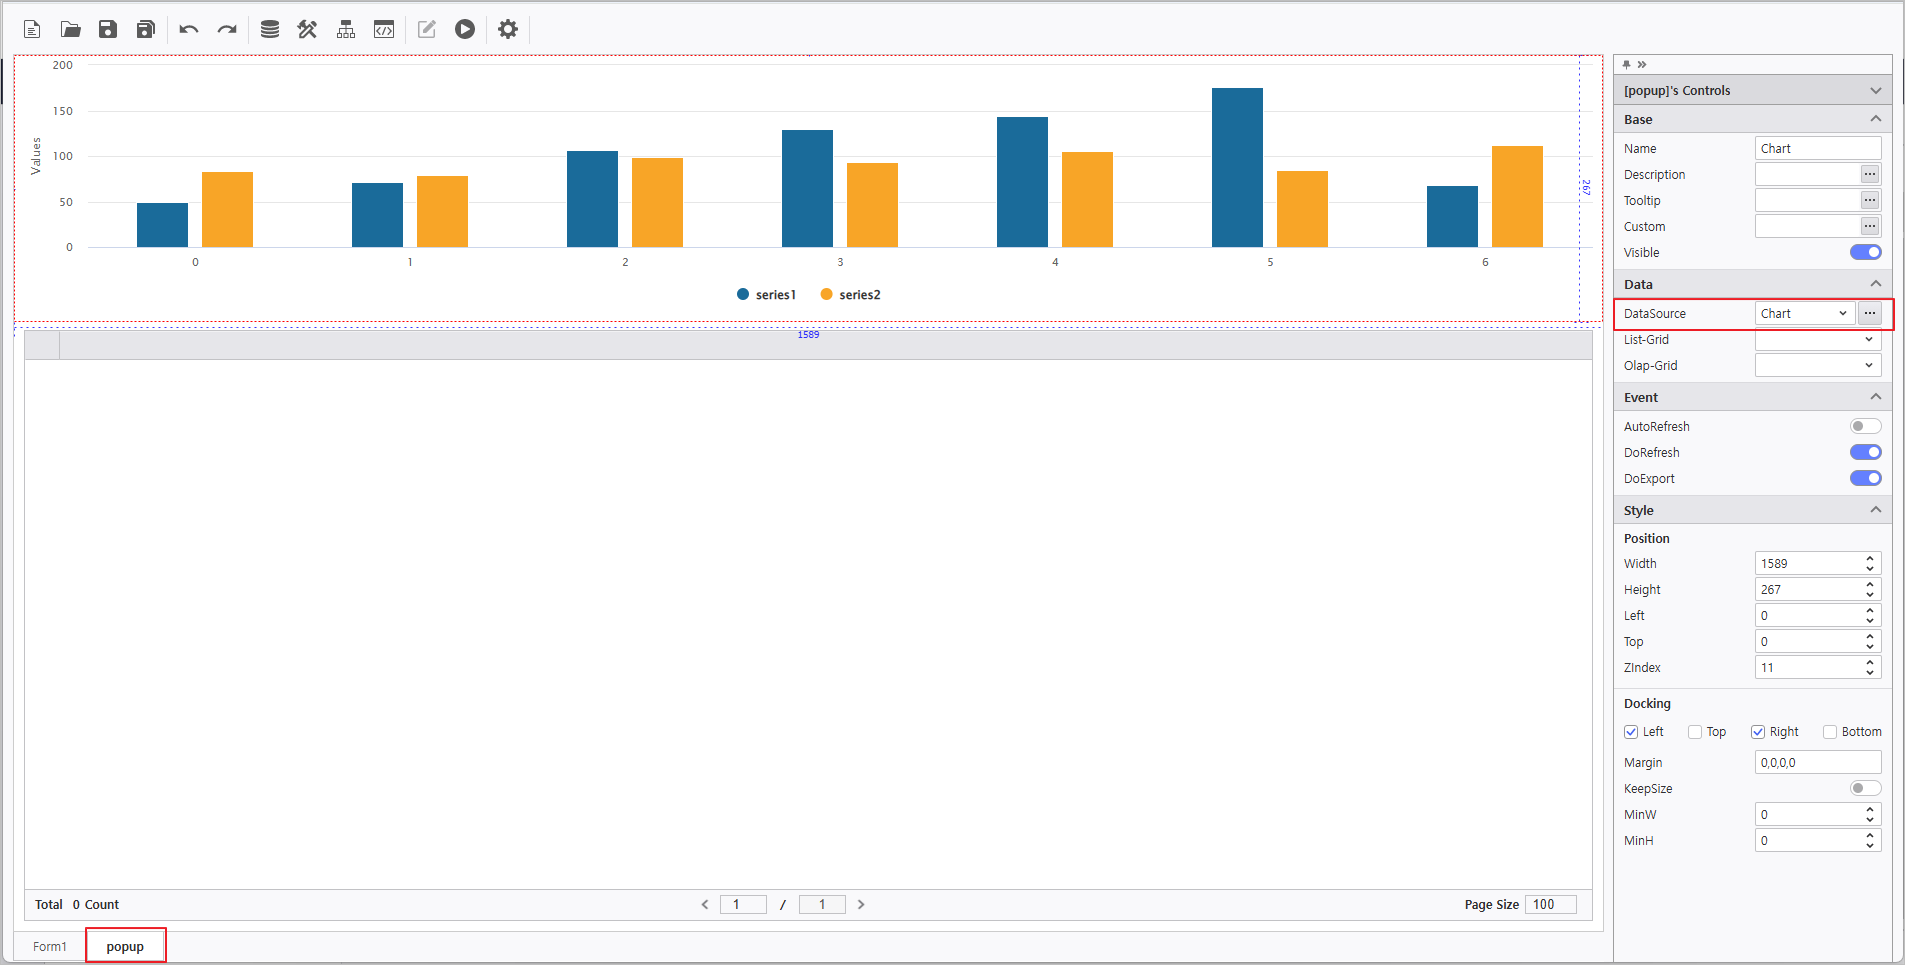
- Configure the screen for the Chart & DataGrid popup that executes upon double-clicking an Olap-Grid data cell.
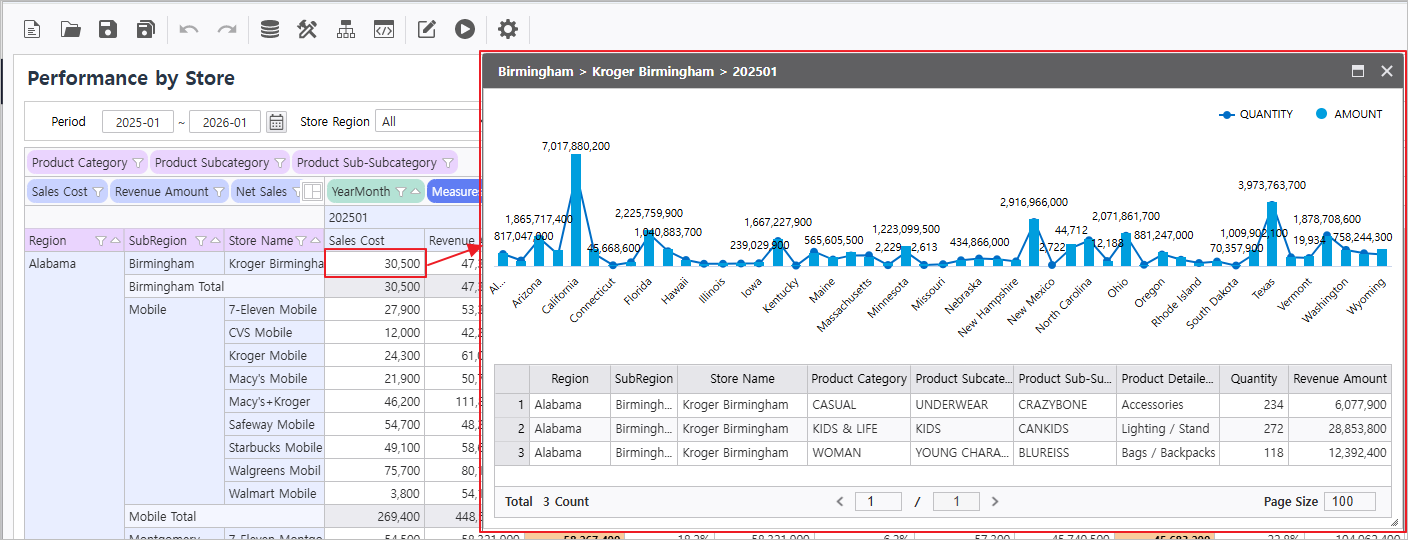
1. Select the [popup] form and bind the data set to the Chart control.
- DataSource : Chart
2. Right-click the List Grid at the bottom and select its Data Source.
- Path : Public Folder > PPDM > Samples > 3. i-META > Sales Analysis

3. Select the i-META file, place the fields, and enter the variable names registered in the Variable Editor into the inquiry condition fields.
-YearMonth :VS_POP_YM
-Region :VS_POP_AREA
-Store Name :VS_POP_STORE

4. Click the [OK] button to close the Data Source selection window, then navigate to Form1 to verify that the report is functioning correctly.