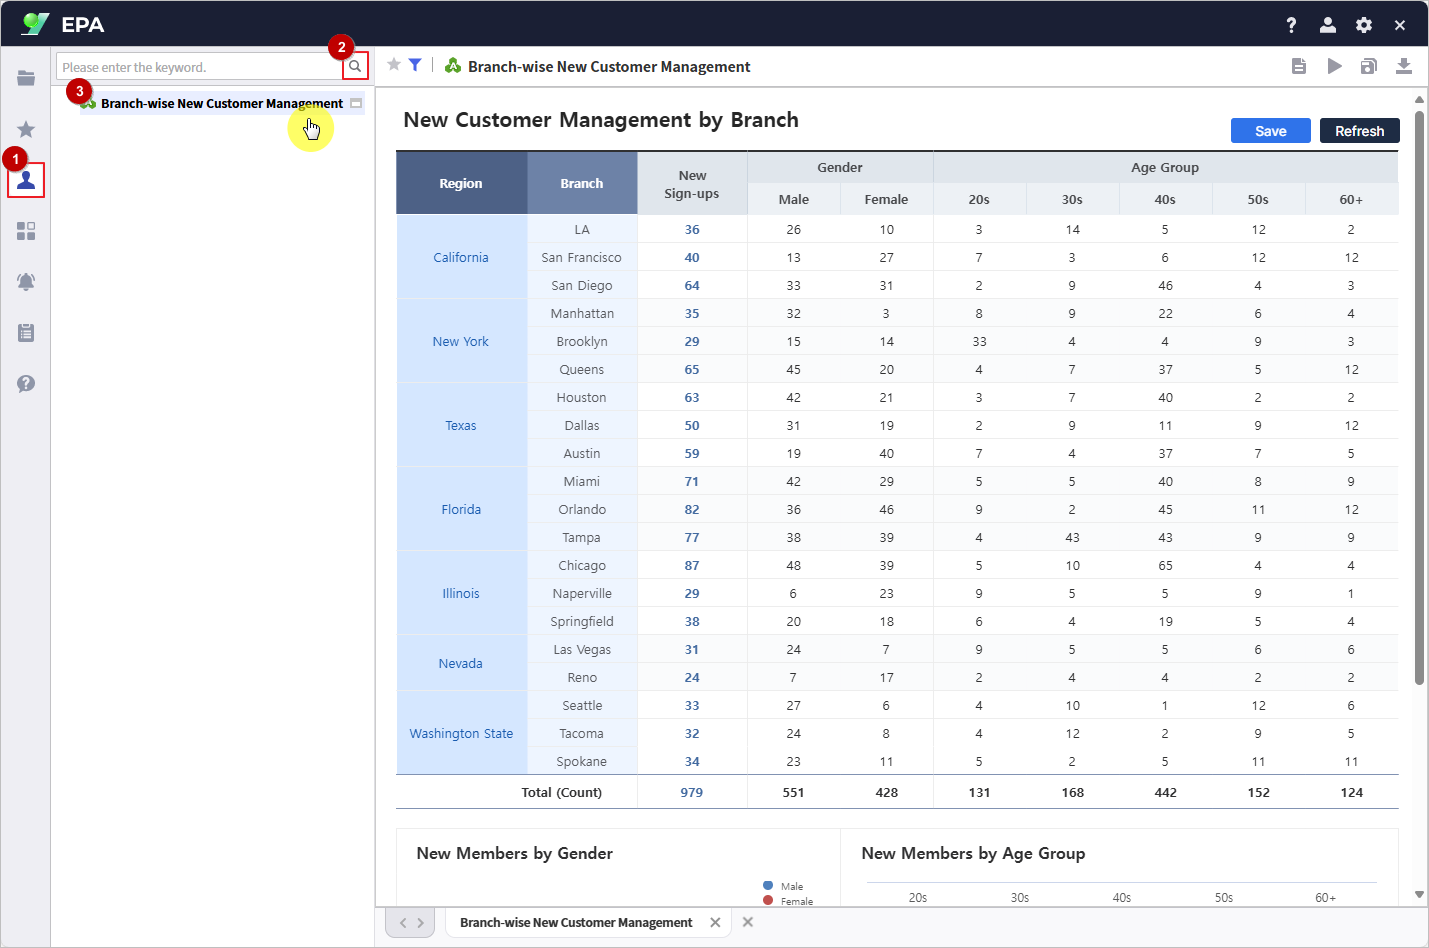
This report allows real-time consolidation and management of new customer data by branch through the web.
Eliminate the manual process of collecting data in Excel and manage all customer information in one centralized platform.
Track new customer sign-ups by branch, gender, and age group effortlessly, enabling central managers to monitor customer acquisition trends at a glance.
Use the provided sample Excel file to experience a more efficient approach to customer management.
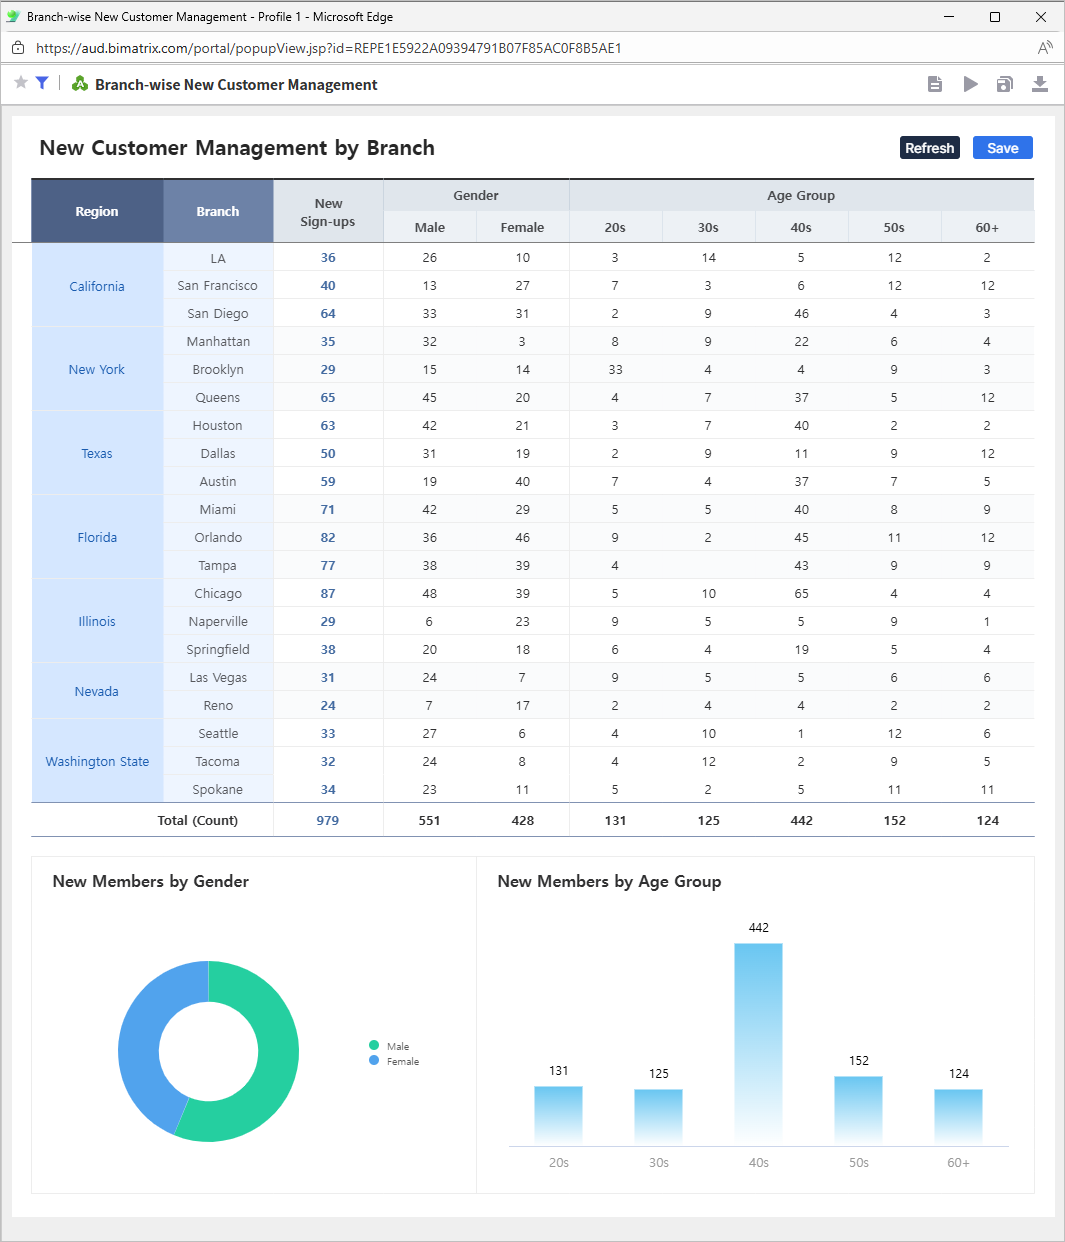
Download the sample Excel file from the Learning Experience Samples.
From the EPA main screen, go to [Menu] > [Tool] and launch i-AUD Designer.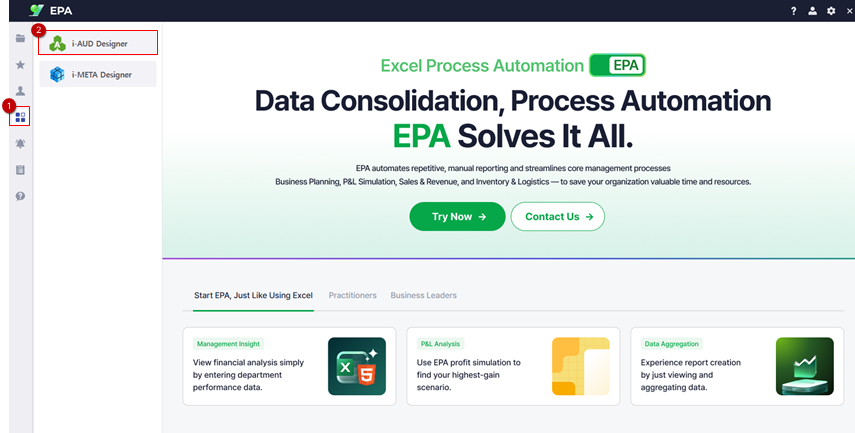
Drag and drop the saved Excel file into the i-AUD Designer window.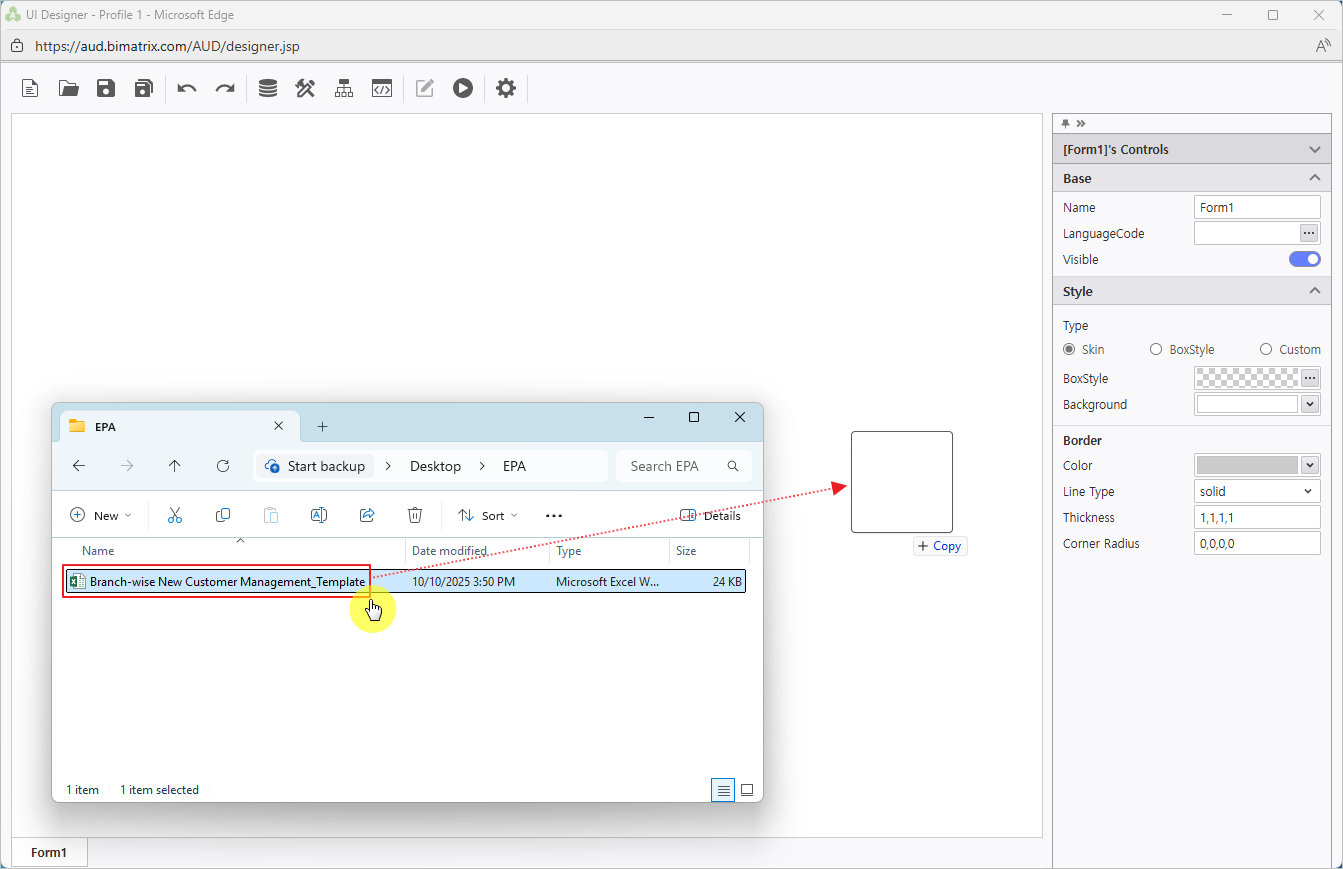
Ensure the report automatically resizes to fit the web browser window.
In the Properties pane on the right, check Docking: Left, Top, Right, Bottom.
To remove the border from the report on the designer screen, set the Line Type property under Border to ‘None’.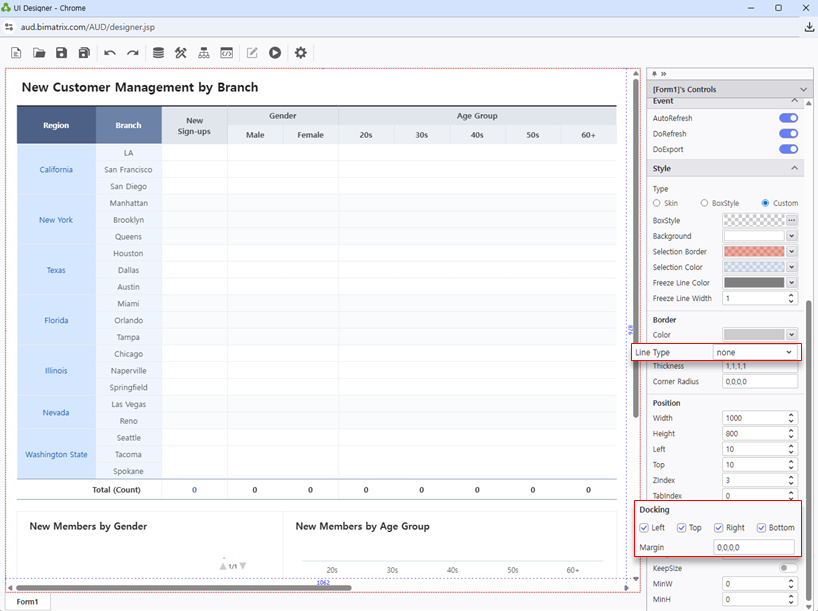
Using Excel’s ‘Name Manager’ and the UI Bot, set up the report so that data can be entered directly on the web.
Right-click on the report area, then select Design.
To configure the data input screen, you must follow these three rules:
|
According to the rules, select the area on the sheet where data will be entered and name it “data1”.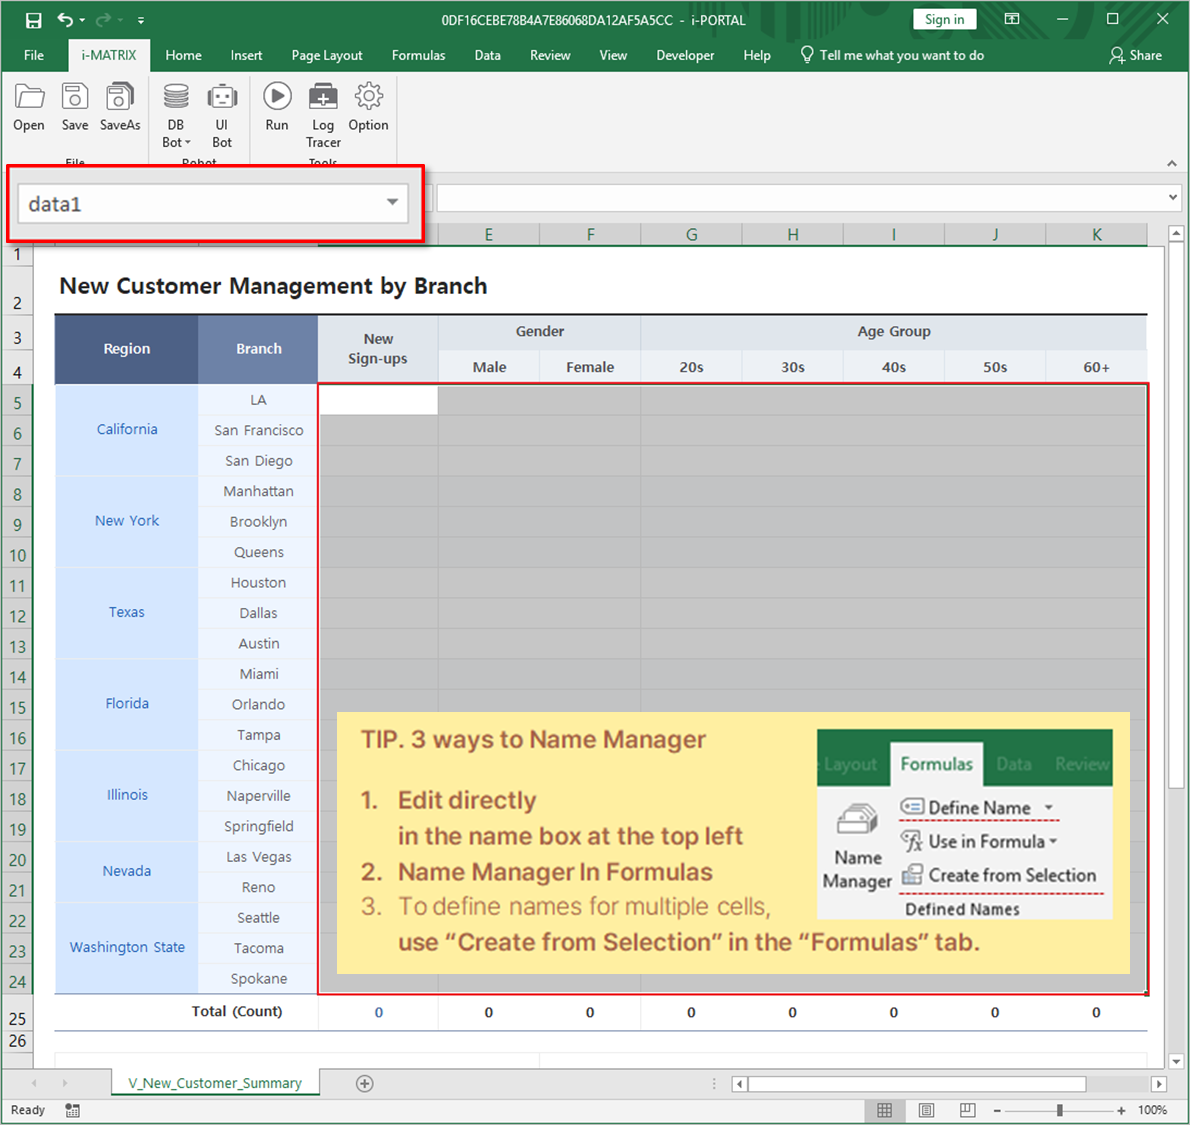
Select the entire table form to be aggregated and name it “table1”.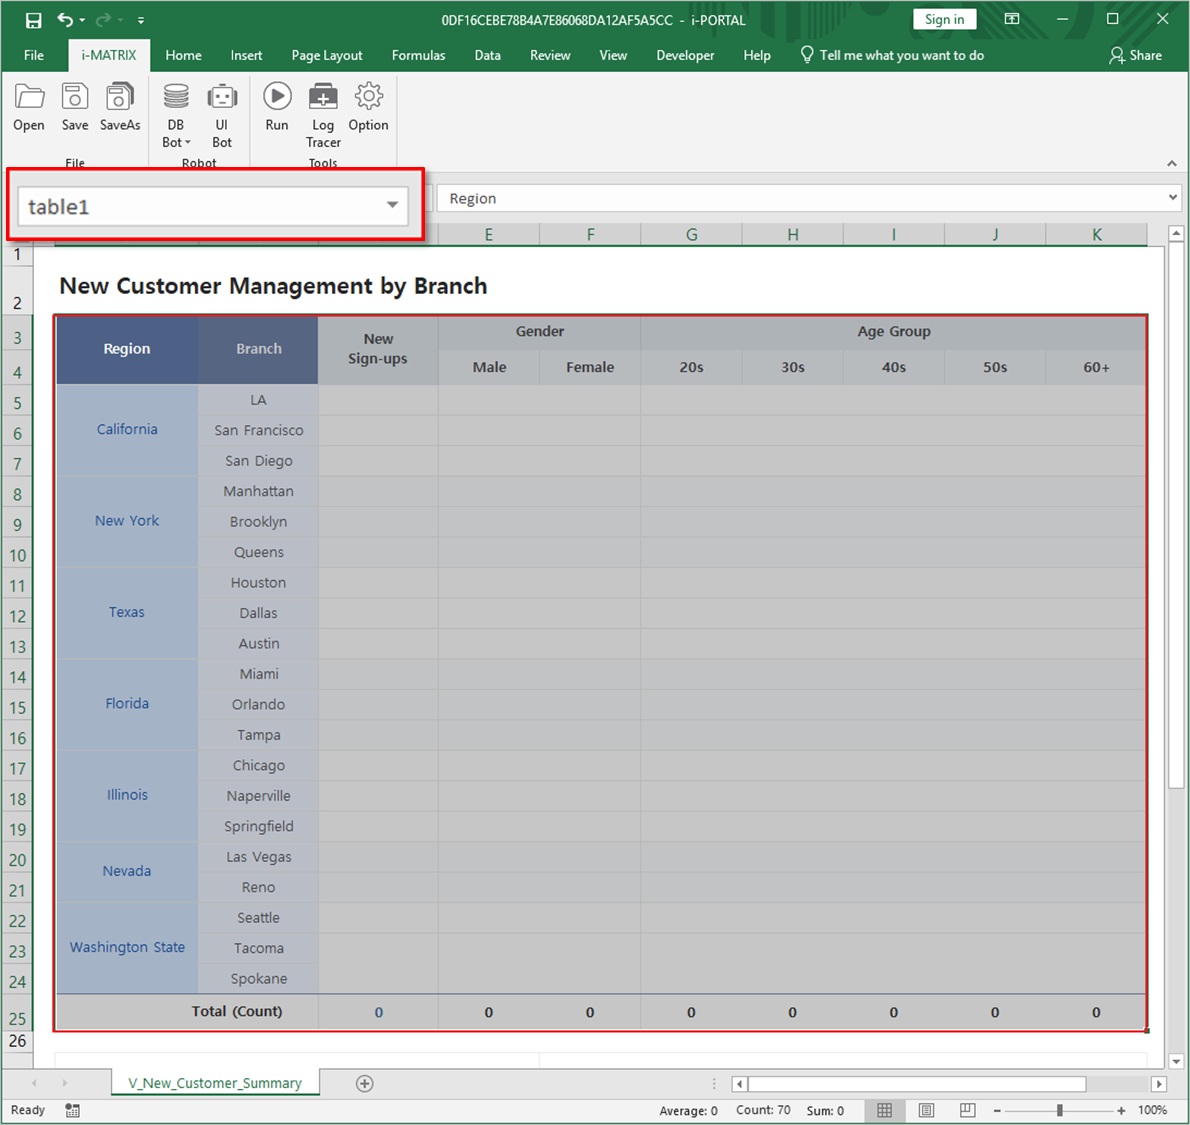
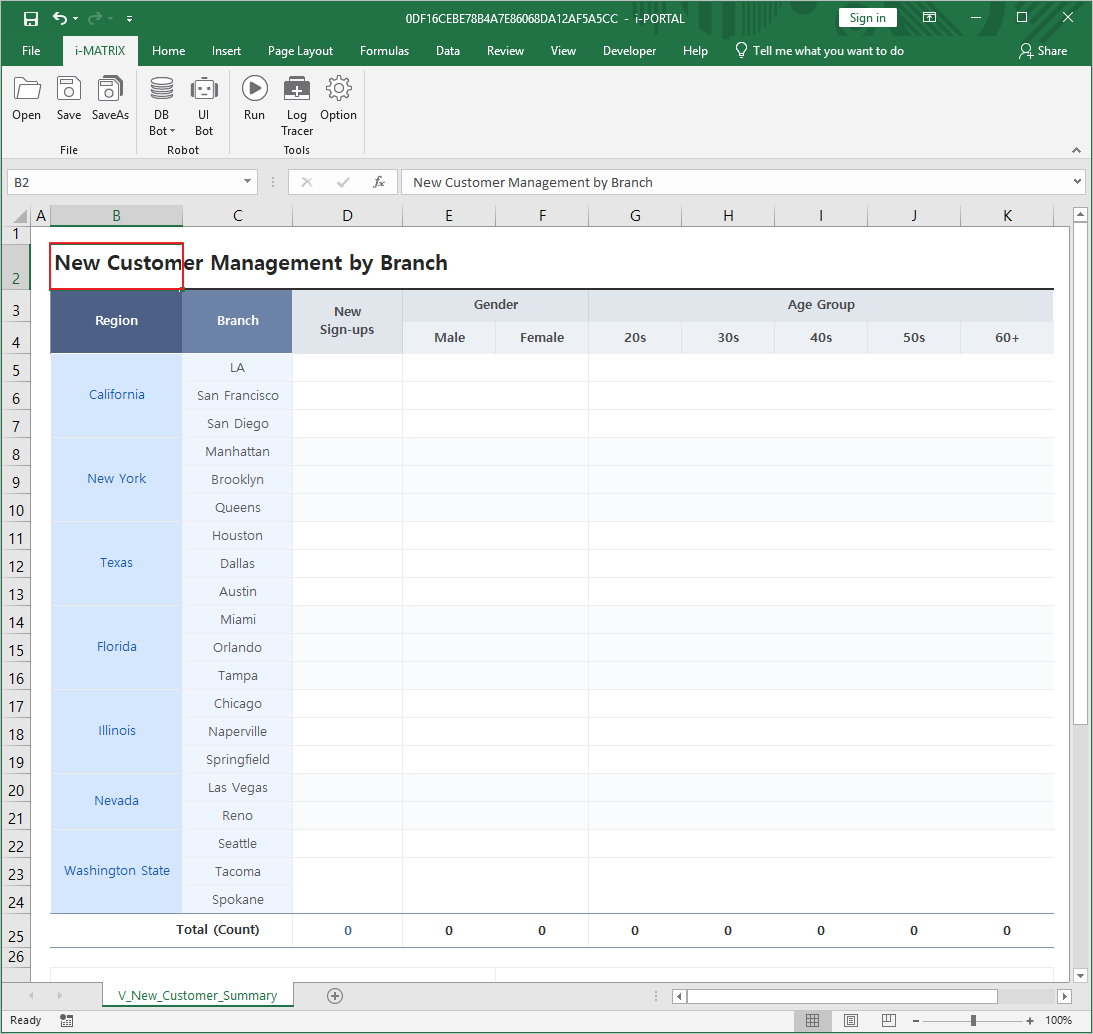
Go to the ‘i-MATRIX’ tab in the ribbon and click 'UI Bot’.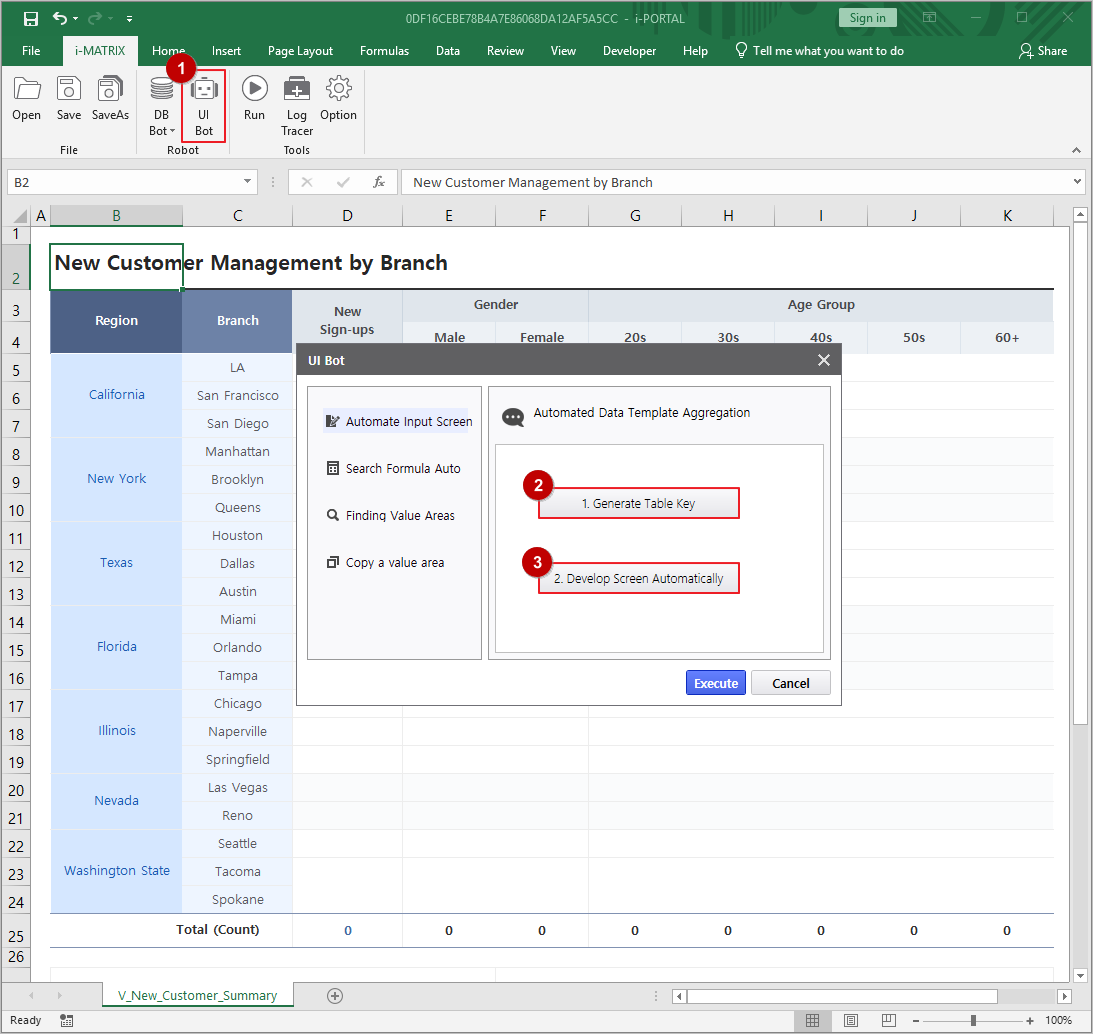
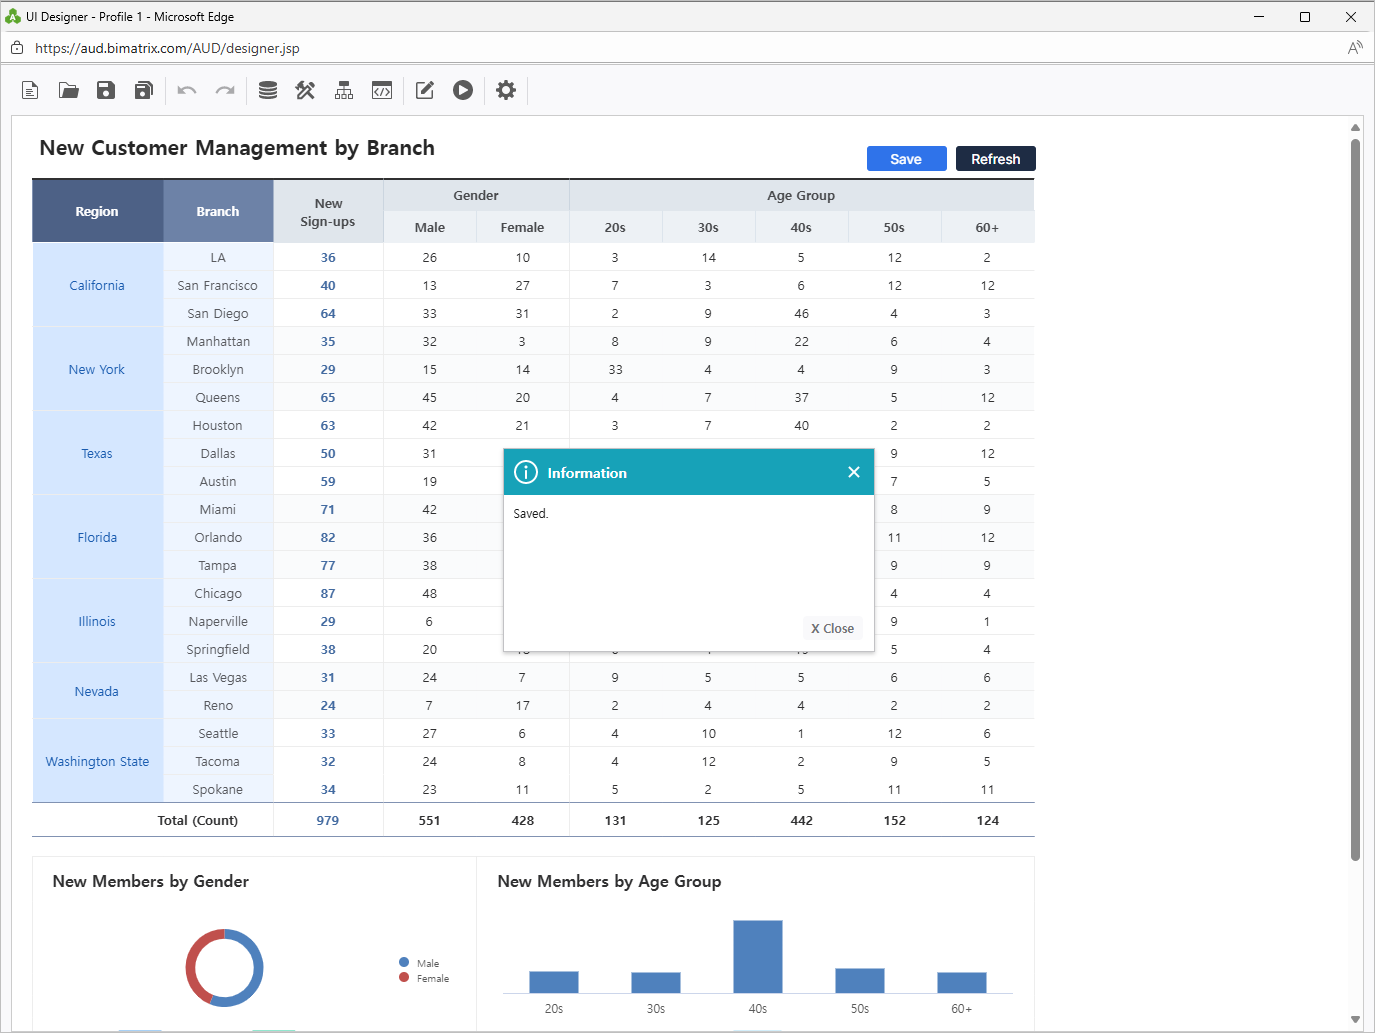
In AUD Designer, double-click an empty cell in the data area and enter a number, Verify that the value is entered and totals are calculated automatically.
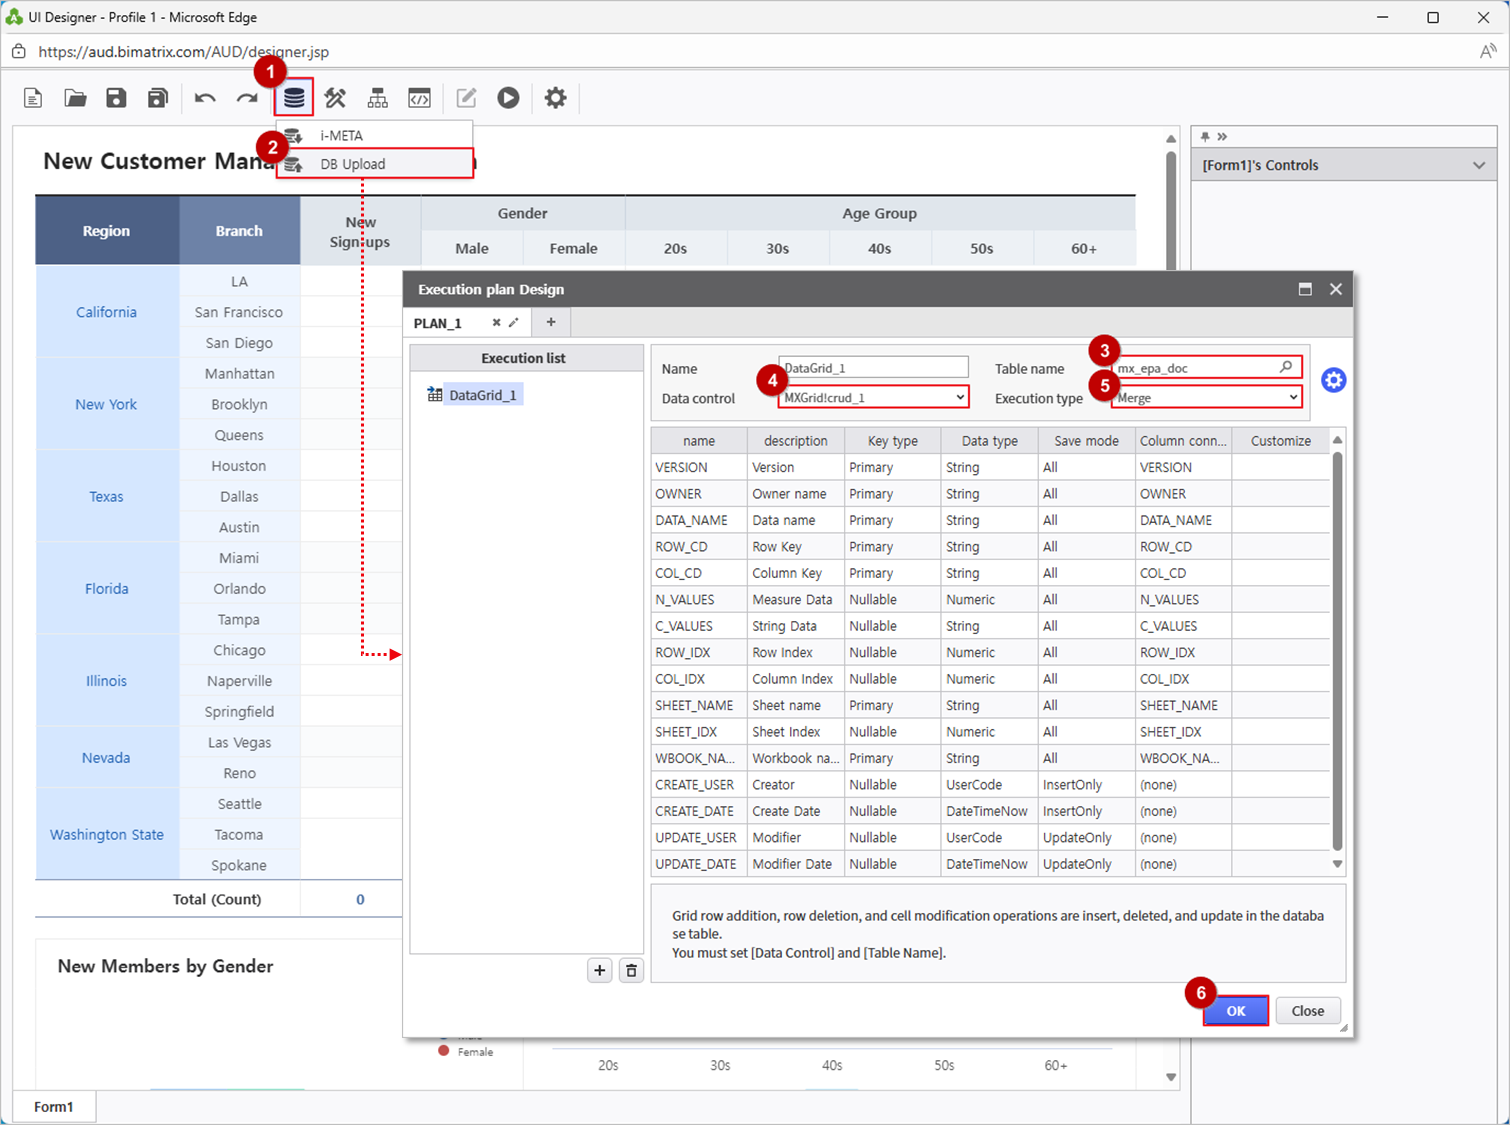
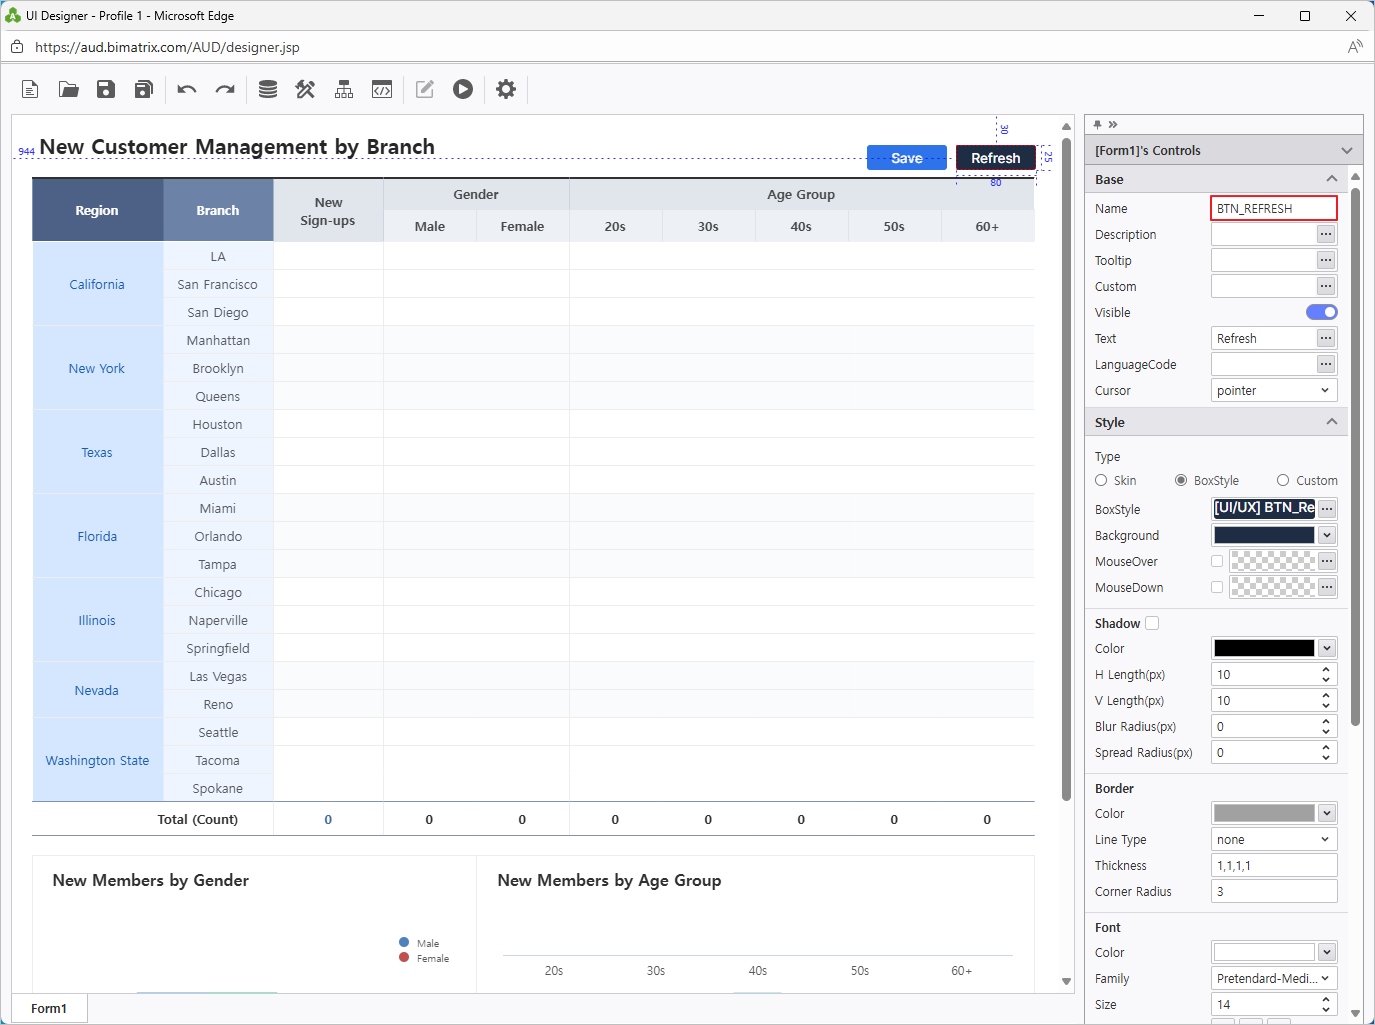
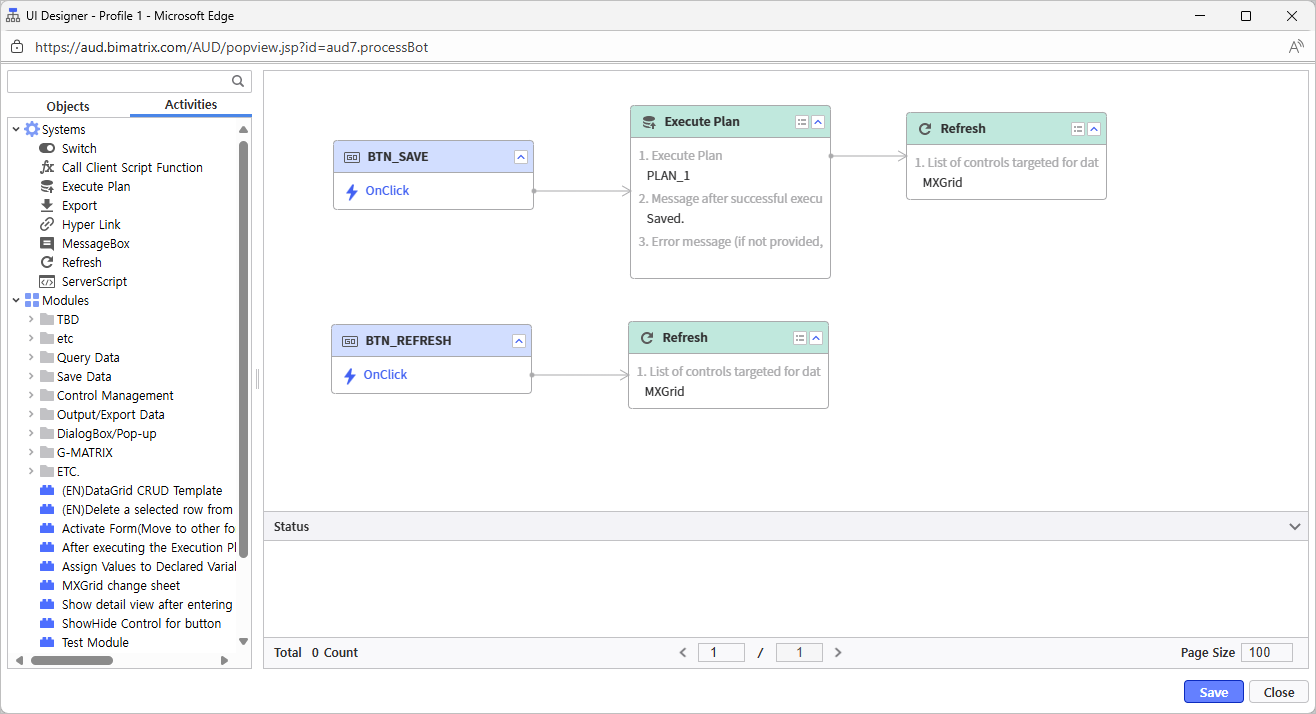
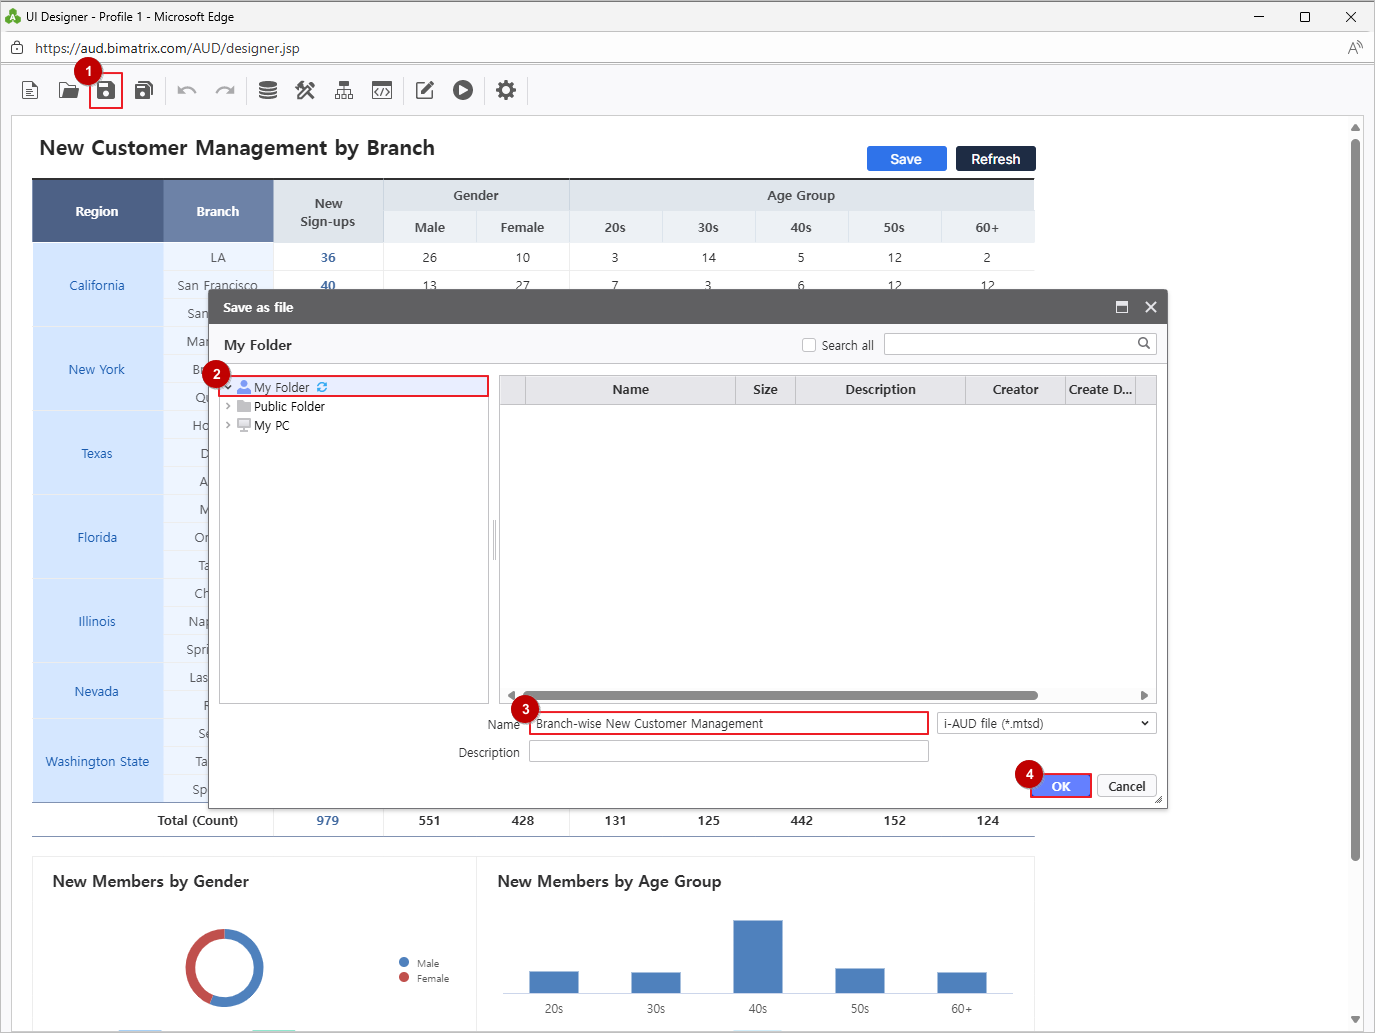
From the EPA main screen, go to [Menu] > [Individual] in the left-hand sidebar.
Click the Search(Magnifying glass icon) button to refresh the report list and confirm your saved report.
Enter data on the web and save it to share with your team.