| Easy Heading Macro | ||||||
|---|---|---|---|---|---|---|
|
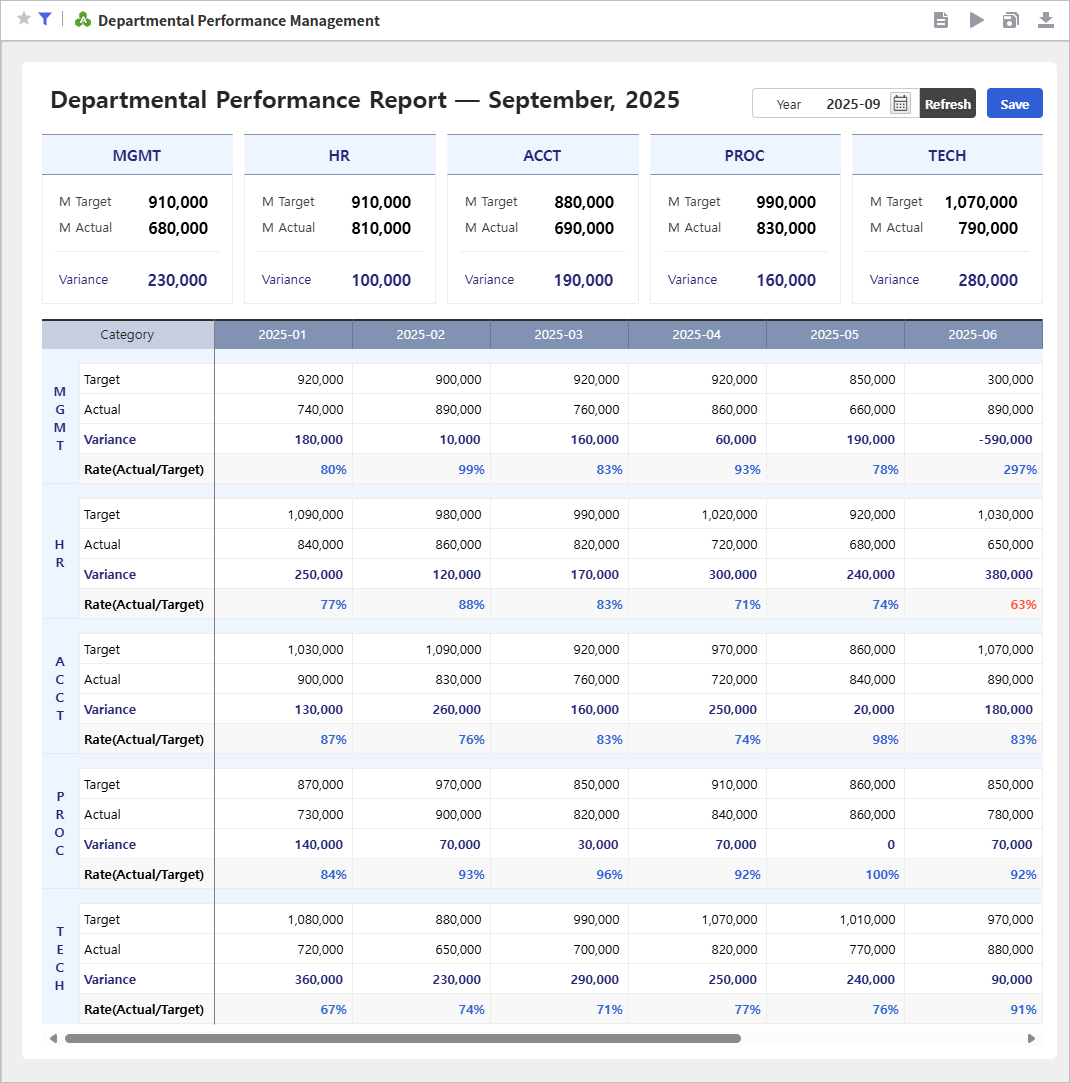
부서별 실적 현황 데이터를 웹에서 실시간으로 취합·관리 할 수 있는 보고서입니다.
엑셀로 수집하던 번거로운 방식에서 벗어나, 이제 웹에서 실시간으로 통합 관리할 수 있습니다.
선택한 날짜의 목표, 실적, 차이, 달성률 데이터를 간편하게 취합하고 중앙 담당자는 별도의 수작업 없이도 전체 현황을 실시간으로 파악할 수 있습니다.
제공된 샘플 엑셀 파일을 활용해 보다 효율적인 실적 현황 관리 업무를 경험해 보세요This report enables real-time consolidation and management of departmental performance data on the web.
Move beyond the hassle of collecting data in Excel — now manage all performance records in one integrated online view.
Easily consolidate target, actual, variance, and achievement rate data for each department, giving managers instant visibility into overall performance without manual updates.
Use the provided sample Excel file to experience a more efficient way to manage departmental performance.
Step 1.
...
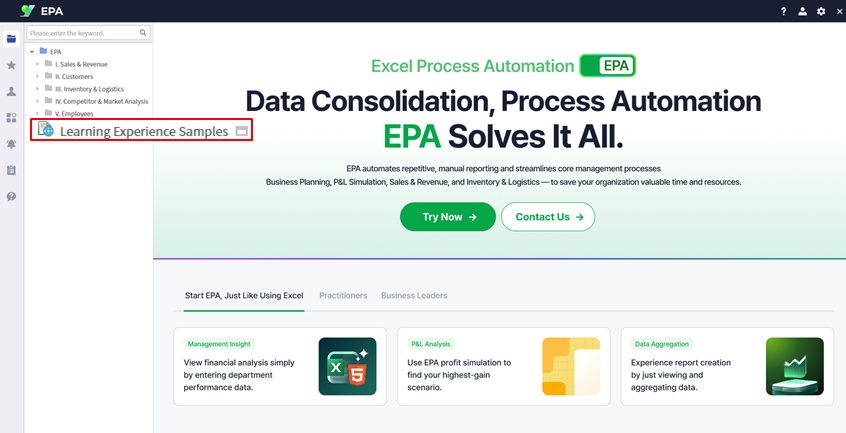
샘플로 제공된 엑셀 파일을 활용해 보겠습니다. 템플릿 엑셀 파일을 EPA 게시판에서 다운로드합니다.
...
변환된 엑셀 화면이 웹 브라우저의 화면 크기에 맞게 자동으로 조정되도록 설정합니다.
...
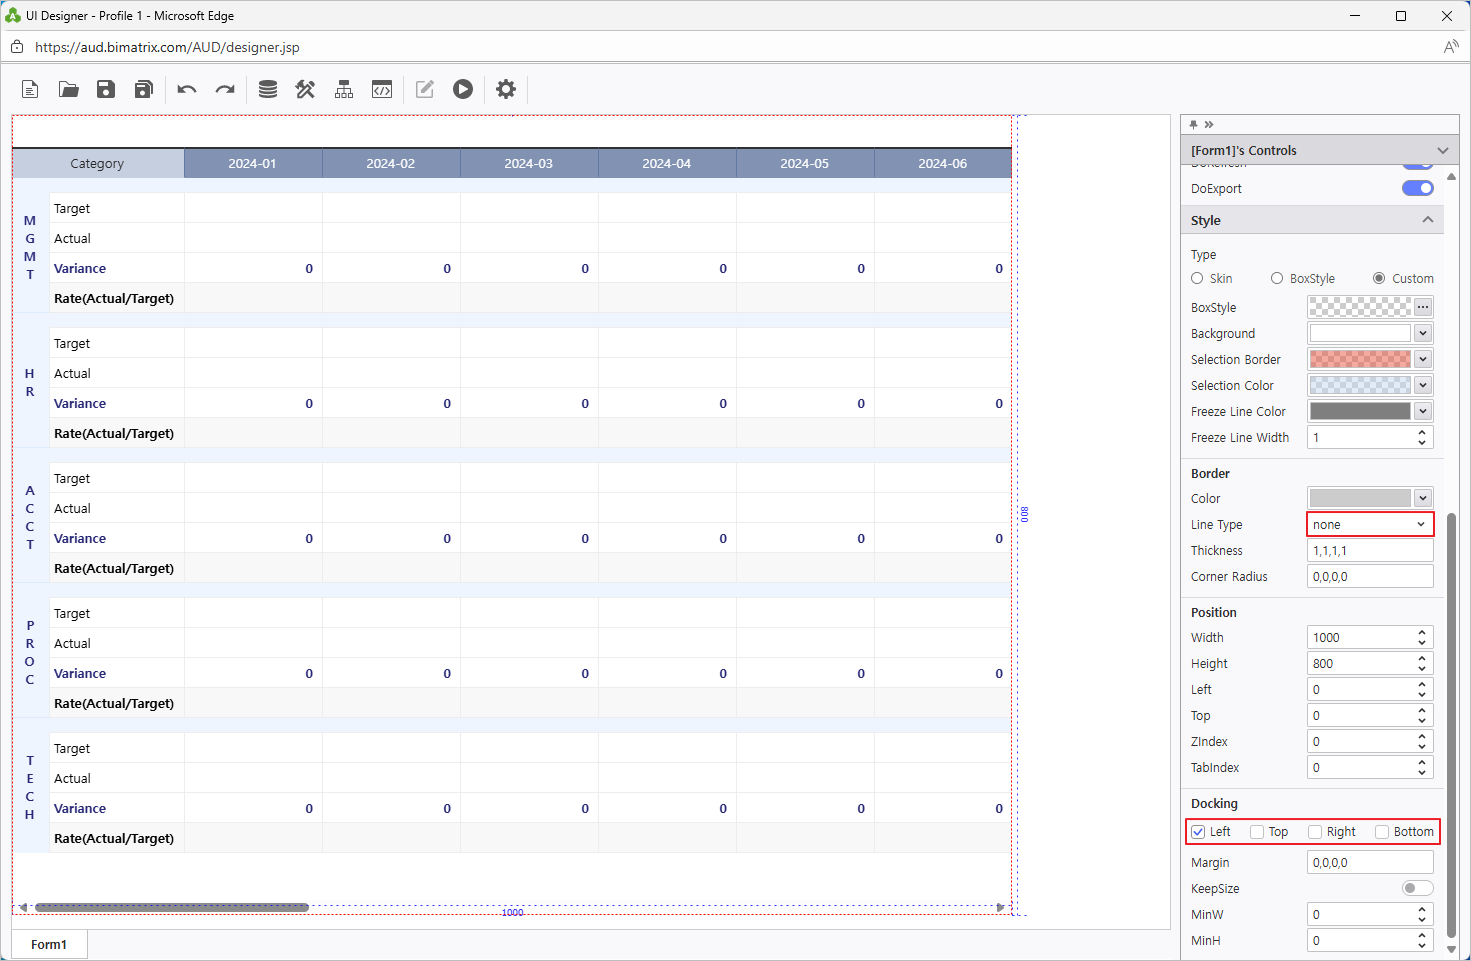
웹으로 변환된 보고서를 선택하고 우측 속성 창 > Docking 영역 Left에 체크 합니다.
...
Convert an Excel file to a web report using i-AUD Designer
Download the sample Excel file from the Learning Experience Samples.
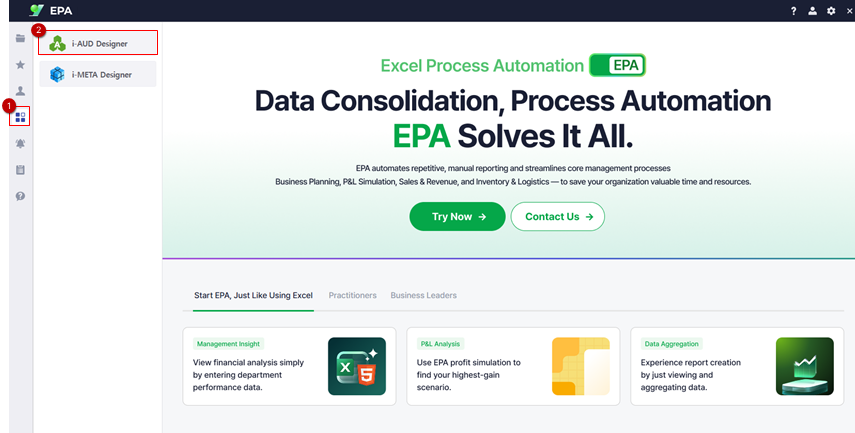
From the EPA main screen, go to [Menu] > [Tool] and launch i-AUD Designer.
Drag and drop the saved Excel file into the i-AUD Designer window.
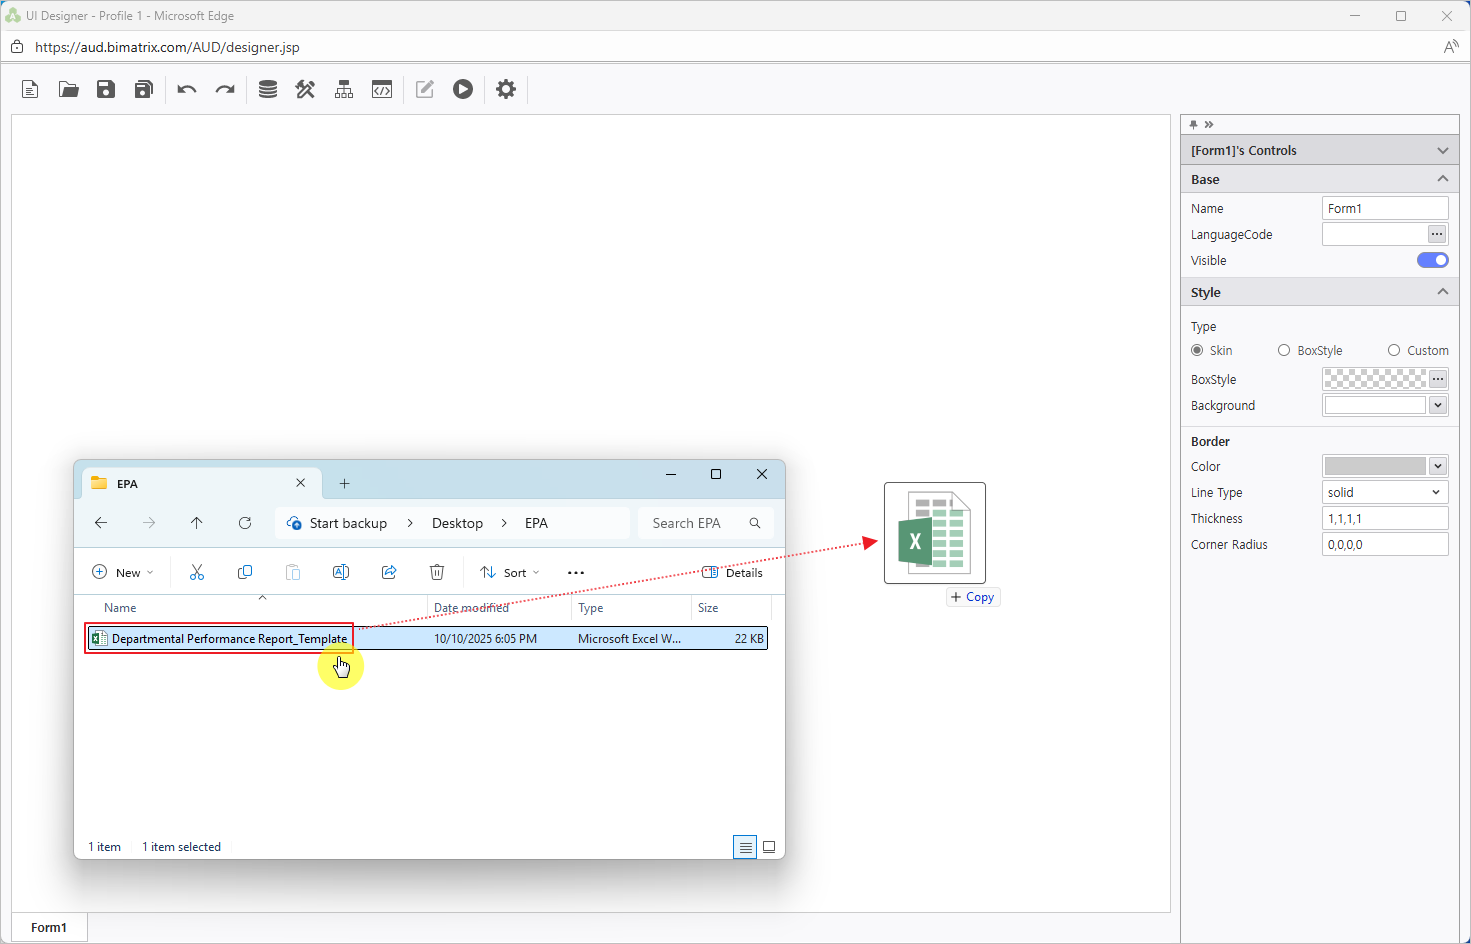
Ensure the report automatically resizes to fit the web browser window.
In the Properties pane on the right, check Docking: Left.
To remove the border from the report on the designer screen, set the Line Type property under Border to ‘None’.
Step 2.
...
엑셀의 이름정의 기능과 UI Bot을 활용해 웹에서 데이터를 입력할 수 있도록 설정해 보겠습니다.
...
Configure the data input screen
Using Excel’s ‘Name Manager’ and the UI Bot, set up the report so that data can be entered directly on the web.
Right-click on the report area, then select Design.
규칙에 맞게 화면에서 데이터를 입력할 영역을 선택하고 선택한 영역의 이름을 'data1'으로 설정합니다.참고사항 title 데이터 입력 화면 이름정의 규칙 데이터 입력 화면을 설정하기 위해서는 반드시 3가지 규칙을 따라야 합니다.
데이터를 입력하는 영역은 "data1"로 이름정의하고,
숫자 입력 영역이라면 셀 서식을 '숫자'로, 텍스트 입력 영역이라면 셀 서식을 '텍스트'로 설정해야 합니다.
취합할 양식의 표 영역은 "table1"로 이름정의합니다.table1로 정의된 영역의 좌측 상단 꼭지점 위치에 테이블 이름을 반드시 작성해야 합니다.
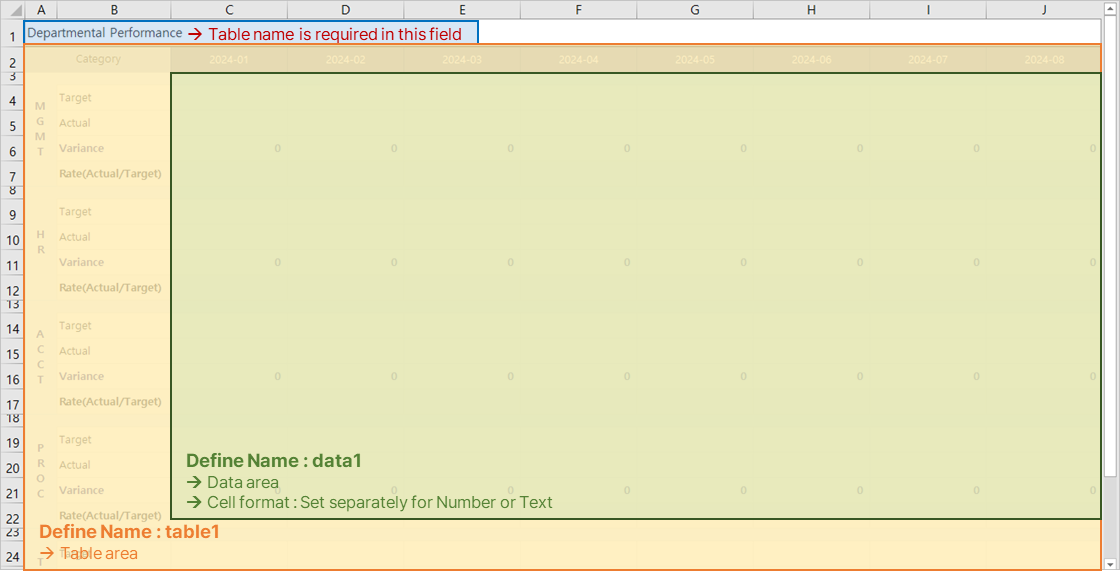
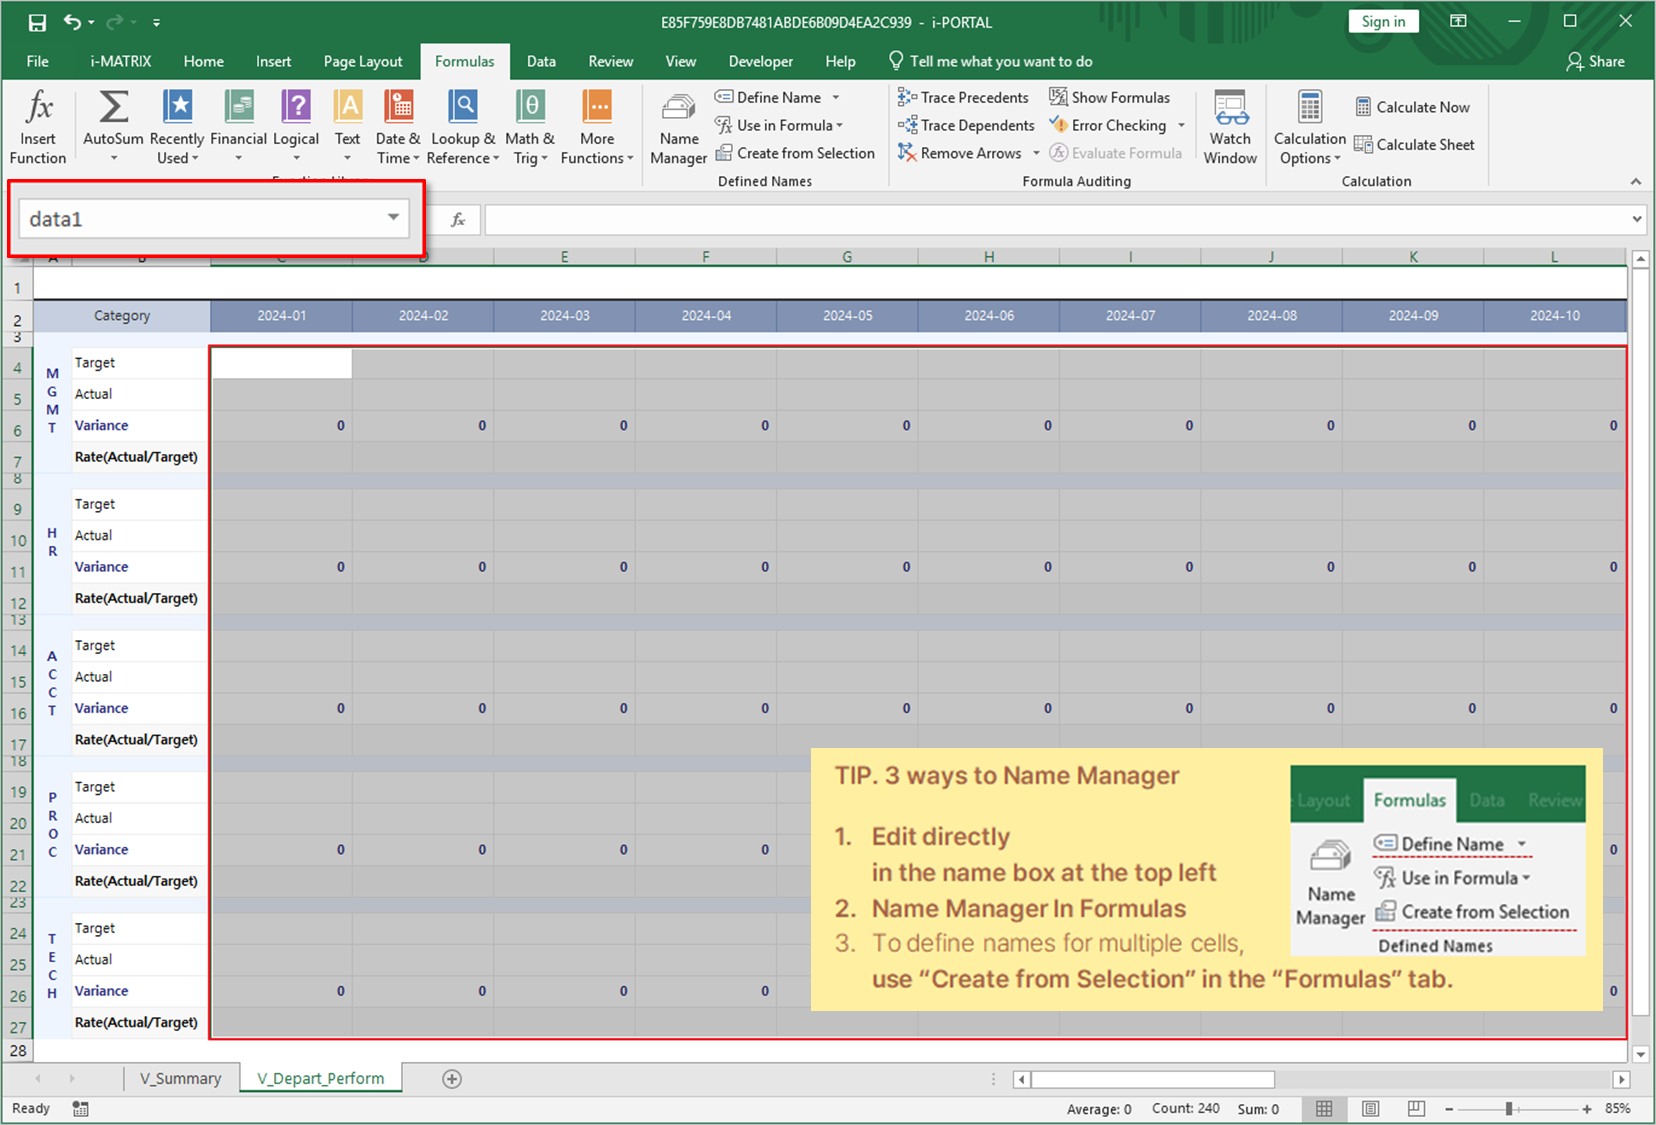
표 양식 전체를 선택하고 선택한 영역의 이름을 'table1'로 설정합니다.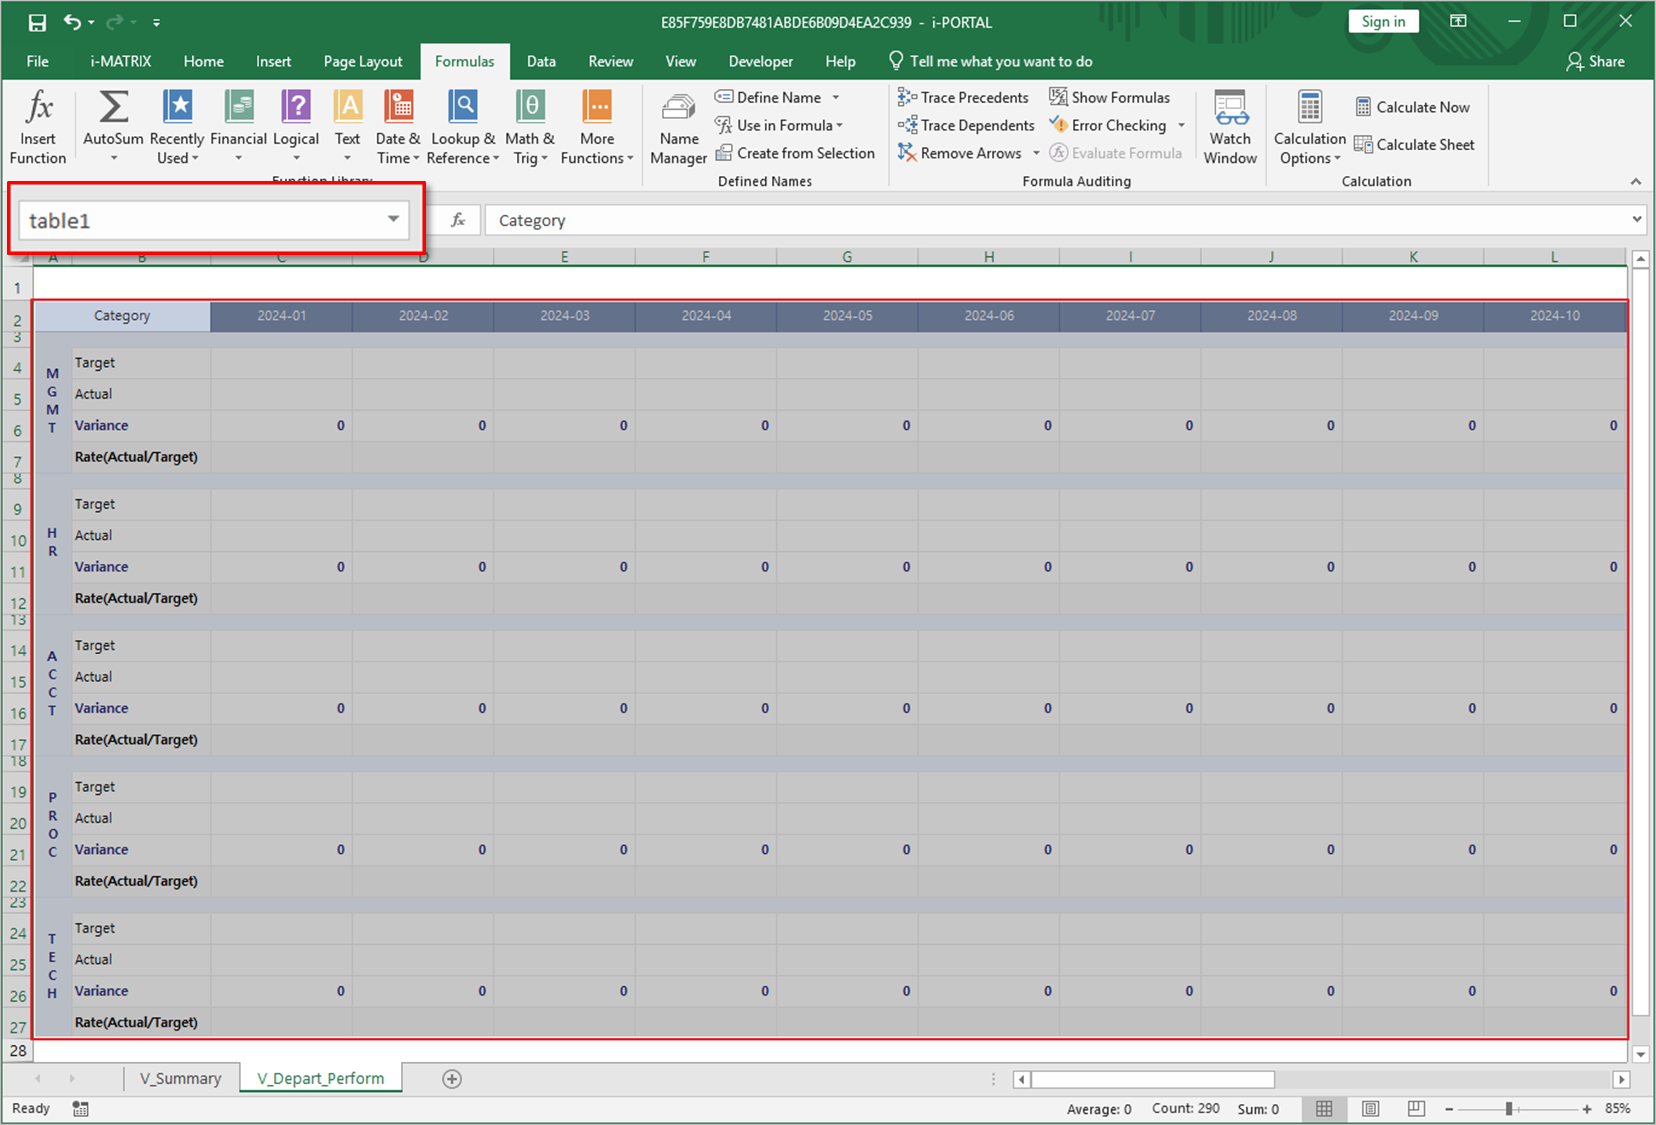
table1로 설정된 영역의 좌측 최상단 꼭짓점 위치에 테이블 이름을 작성합니다.
만약 이 부분이 웹 화면에서 보이지 않아도 된다면 엑셀의 행 숨기기 기능을 활용하여 숨길 수 있습니다.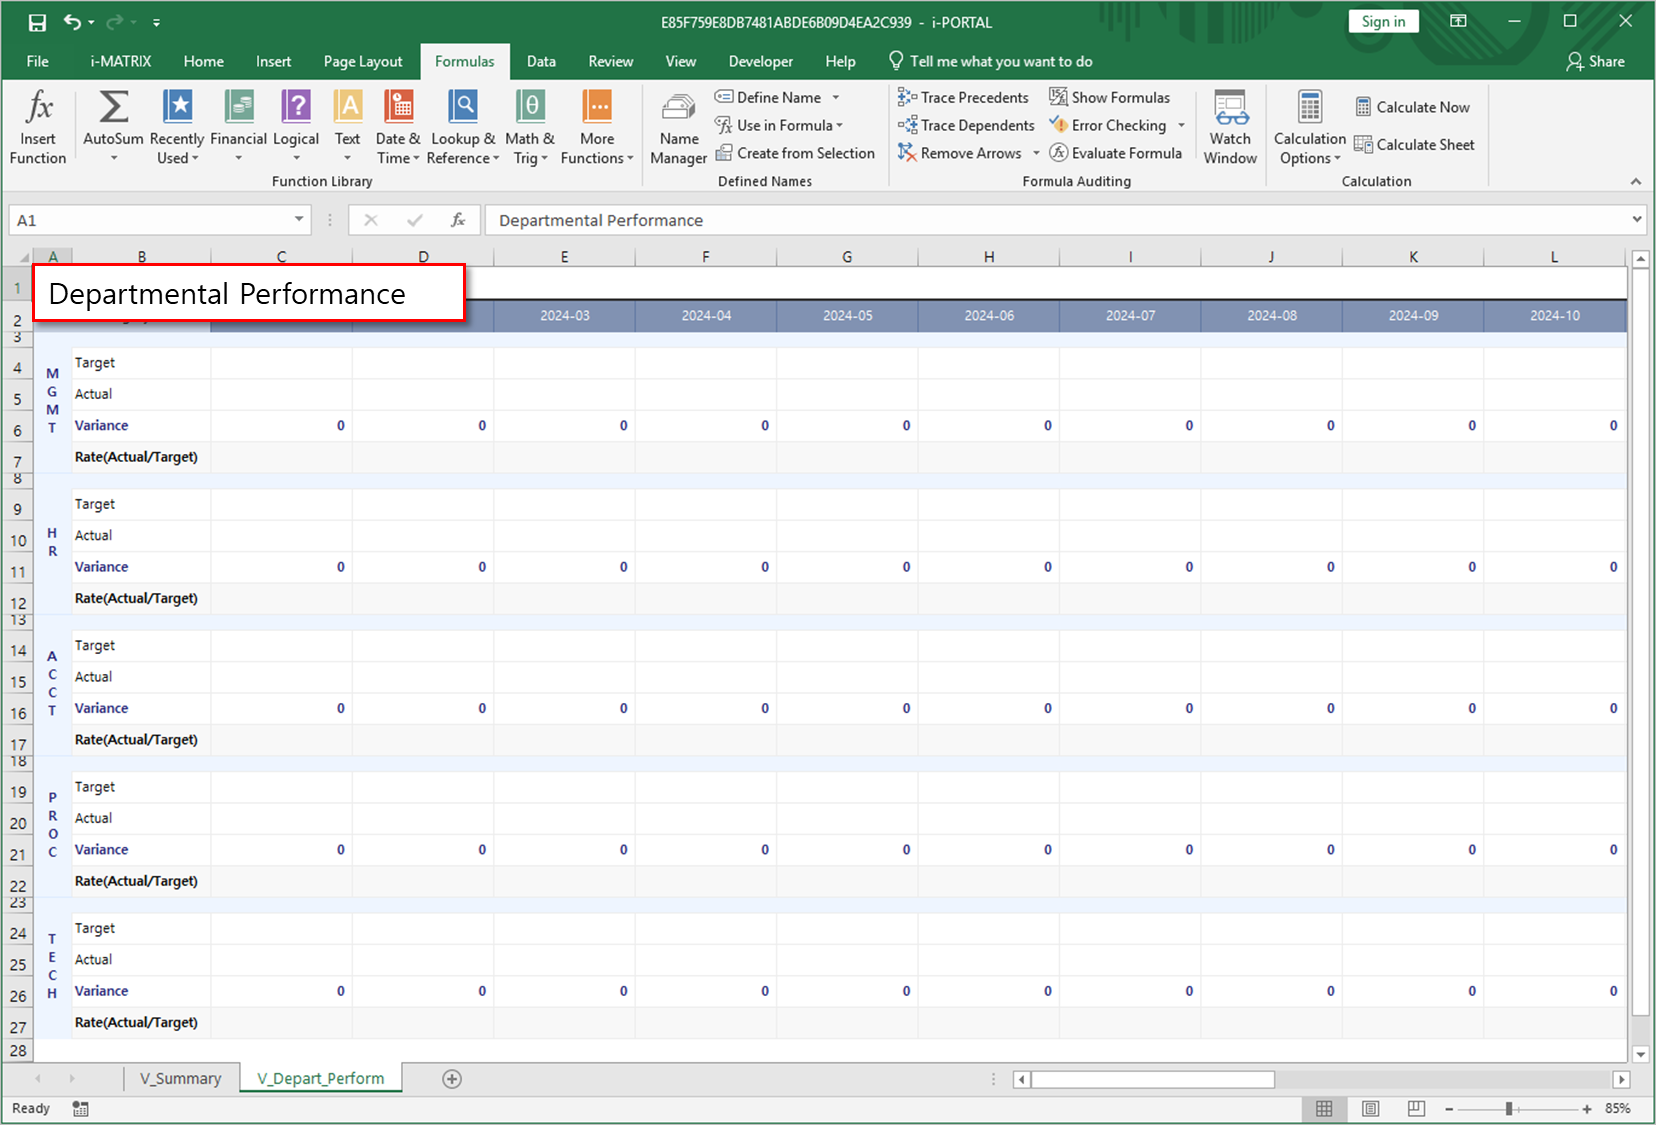
데이터를 웹에서 입력 받기 위한 설정이 완료되었습니다.
이제 클릭만으로 데이터를 입력 받아 저장하고, 저장된 데이터를 조회해 오도록 설정해 보겠습니다.
상단 리본 메뉴 'i-MATRIX' 탭에서 'UI Bot'을 클릭합니다.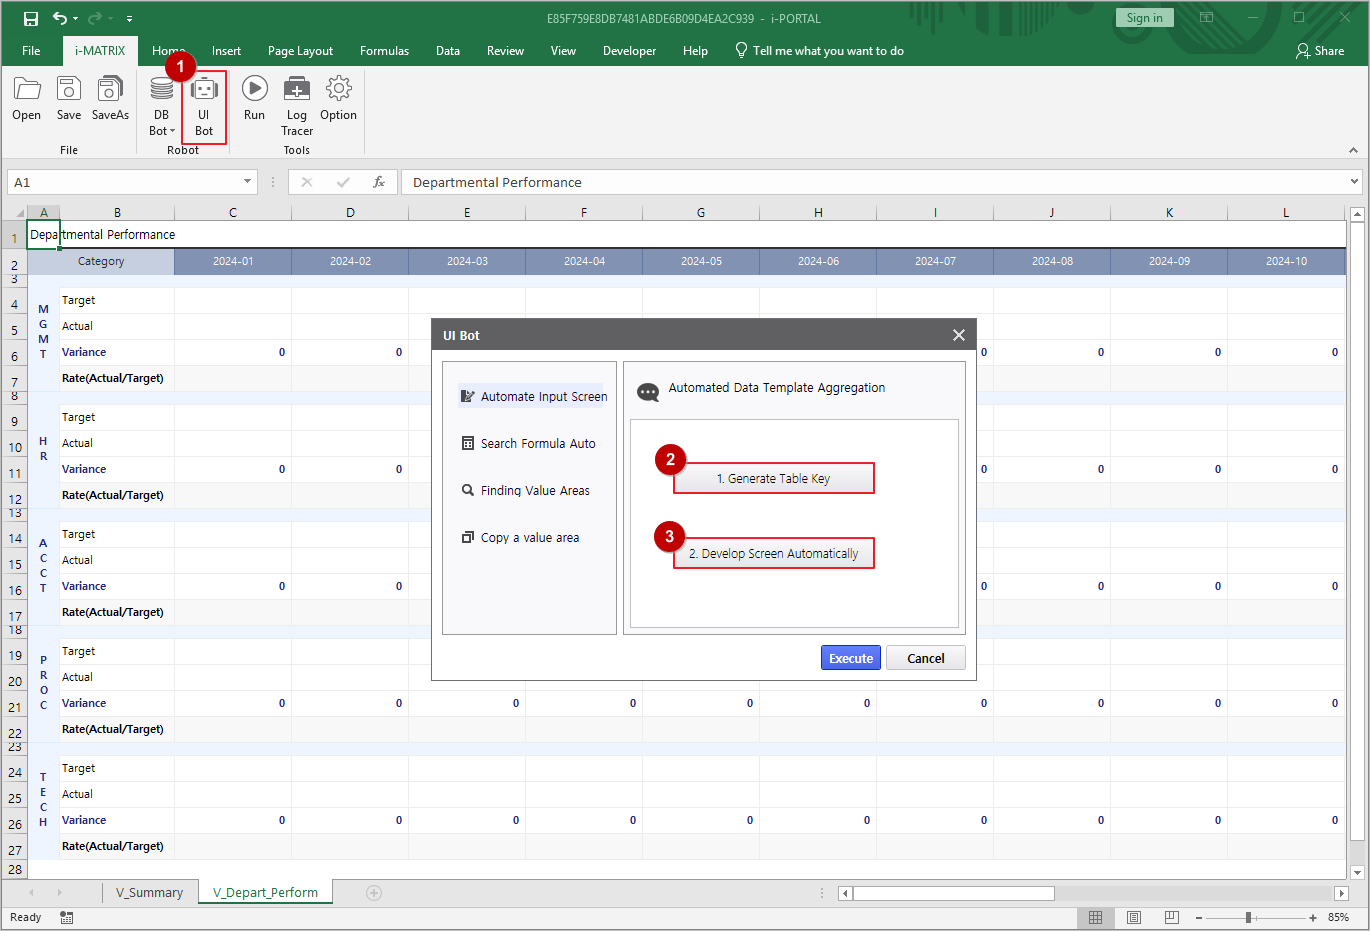
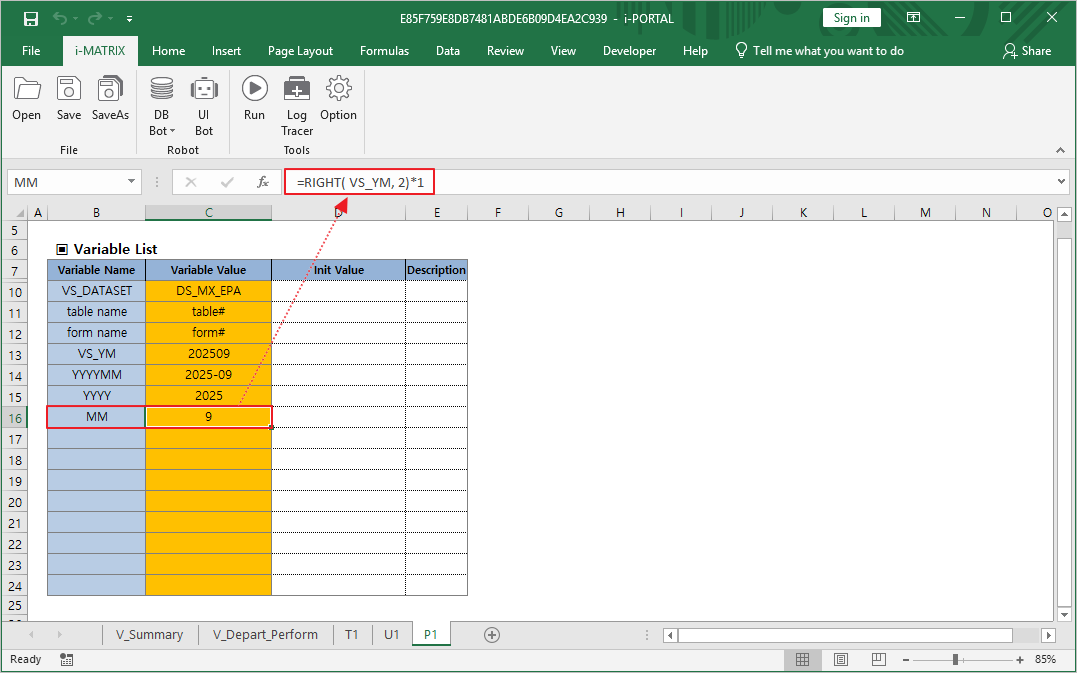
- P1 시트로 이동하여 캘린더로 선택한 날짜에 대한 부서별 실적 화면이 표시될 수 있도록 VS_YM 변수를 활용 하겠습니다.
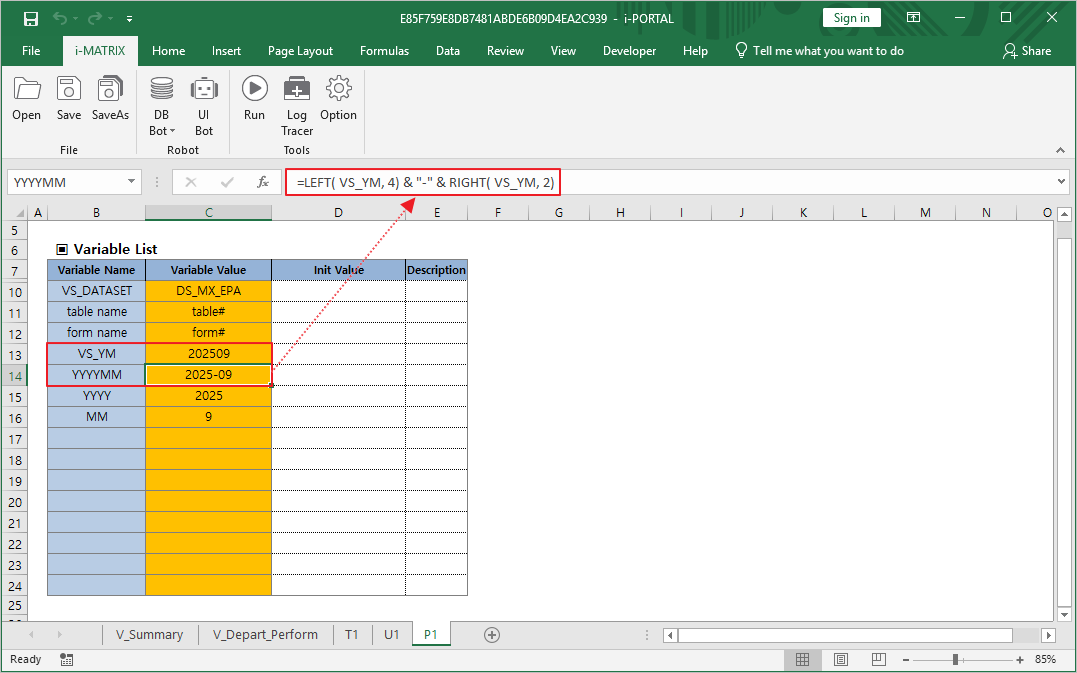
- VS_YM 변수를 이름 정의하고 원하는 년월 날짜를 입력합니다.
- 추가로 YYYYMM, YYYY, MM도 이름 정의하고 수식을 입력합니다.
YYYYMM 수식Naming Rules for the Data Input Screen To configure the data input screen, you must follow these three rules:
Name the data entry area “data1”.
Set the cell format to ‘Number’ for numeric input and ‘Text’ for text input.Name the table area to be aggregated “table1”.
In the top-left corner of the area defined as table1, you must enter the table name.
According to the rules, select the area on the sheet where data will be entered and name it “data1”.
Select the entire table form to be aggregated and name it “table1”.
- In the top-left corner of the area defined as table1, enter the table name.
If you don’t want this to be visible on the web, you can hide the row in Excel. - The setup for web data entry is now complete.
Next, we will configure the report so that data can be entered and saved with a click, and the saved data can be retrieved. Go to the ‘i-MATRIX’ tab in the ribbon and click 'UI Bot’.
- Move to the P1 sheet. Use the VS_YM variable so that department performance can be displayed based on the date selected via the calendar.
- Define the VS_YM variable and enter the desired year and month.
- Additionally, define YYYYMM, YYYY, and MM, and set the formulas as follows.
- YYYYMM formula : =LEFT( VS_YM, 4) & "-" & RIGHT( VS_YM, 2)
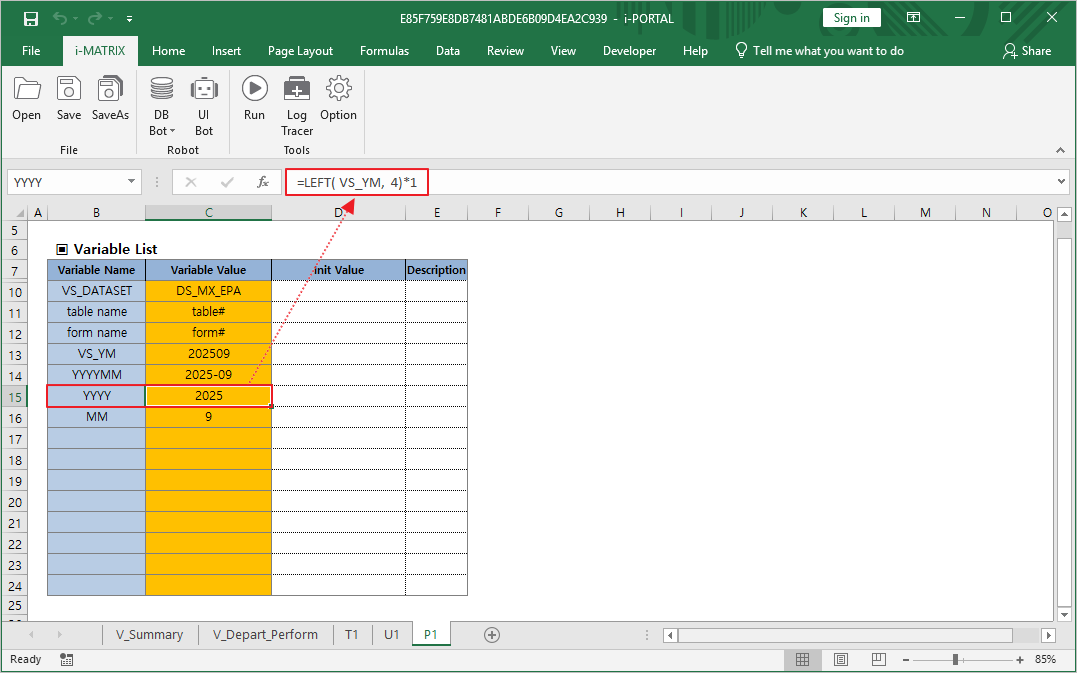
- YYYY 수식 formula : =LEFT( VS_YM, 4)*1
- MM 수식 formula : =RIGHT( VS_YM, 2)*1
- 이제 'V_부서별 예산관리' 시트로 이동하여 캘린더로 선택한 년도와 월까지만 표시되도록 설정하겠습니다.
- 웹 화면에서 열을 숨김 처리 할 수 있는 AUD_HIDE_COLUMNS를 활용해 데이터가 표시될 모든 열의 상단에 수식을 입력합니다.
수식 Now, let’s move to the ‘V_Depart_Perform’ sheet. - Use AUD_HIDE_COLUMNS to hide columns in the web display that fall outside the selected year and month.
Formula : =AUD_HIDE_COLUMNS( OR( LEFT( E4, 4 )*1 <> YYYY, RIGHT( E4, 2 )*1 > MM ))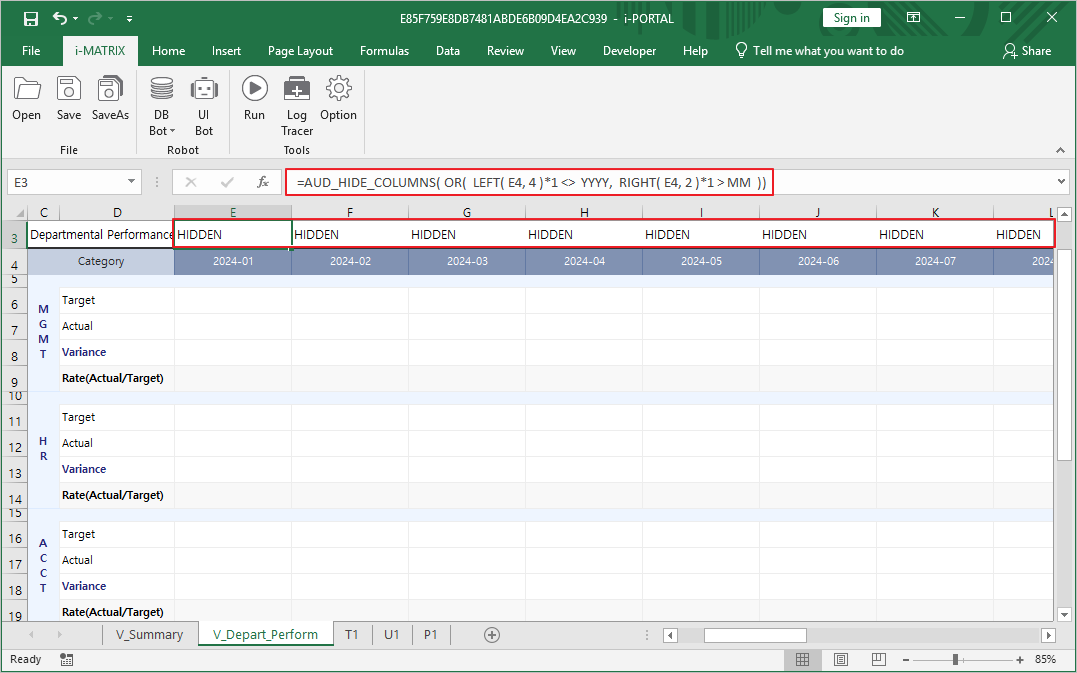
'V_부서별 요약' 시트 좌측 상단에 입력 화면 제목을 표시할 수 있도록 수식을 입력하겠습니다.
수식 : =YYYY &"년 "& MM &"월 실적 현황 보고서"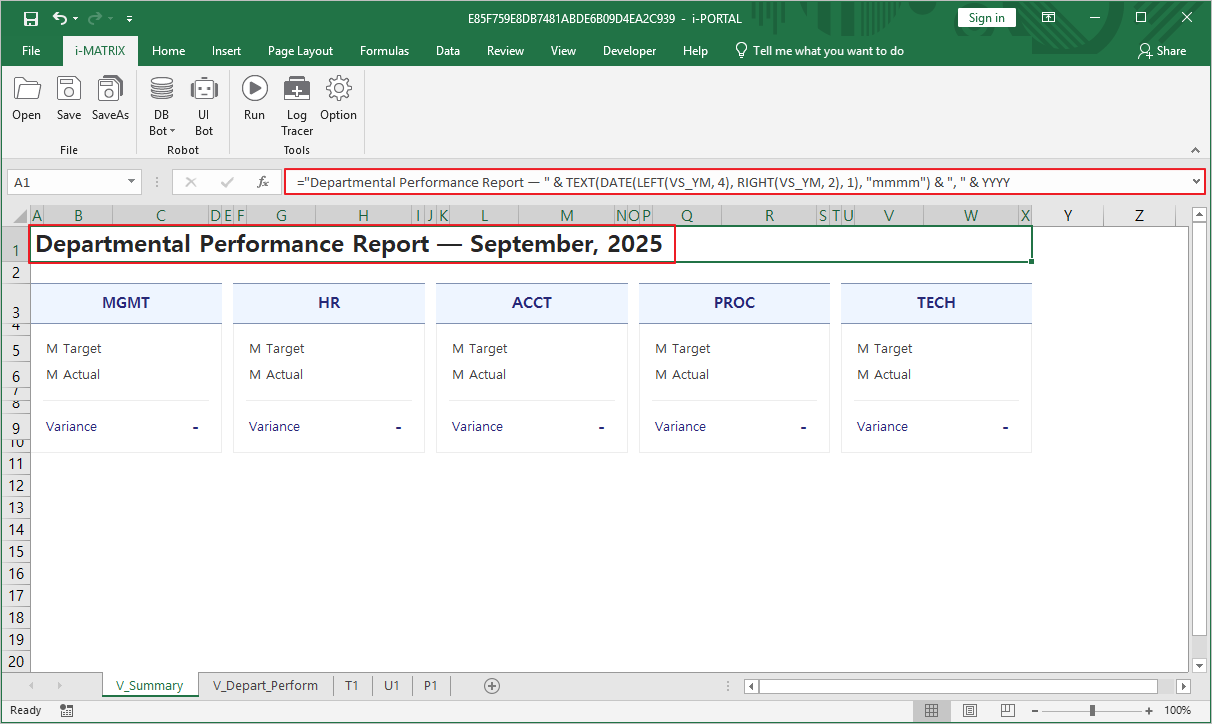
- 보고서 설정과 저장까지 완료되었습니다. AUD Designer 화면으로 돌아갑니다.
Step 3. 데이터 저장할 DB 연결하고 버튼 설정하기
AUD Designer에서 데이터 영역의 빈 셀을 더블 클릭하고 숫자를 입력하면 값이 입력되고 합계가 자동으로 계산되는 것을 확인할 수 있습니다.
- 이제, 이렇게 입력한 데이터를 DB에 저장하기 위해 DB를 연결하고, 저장/조회 버튼을 설정해 보겠습니다.
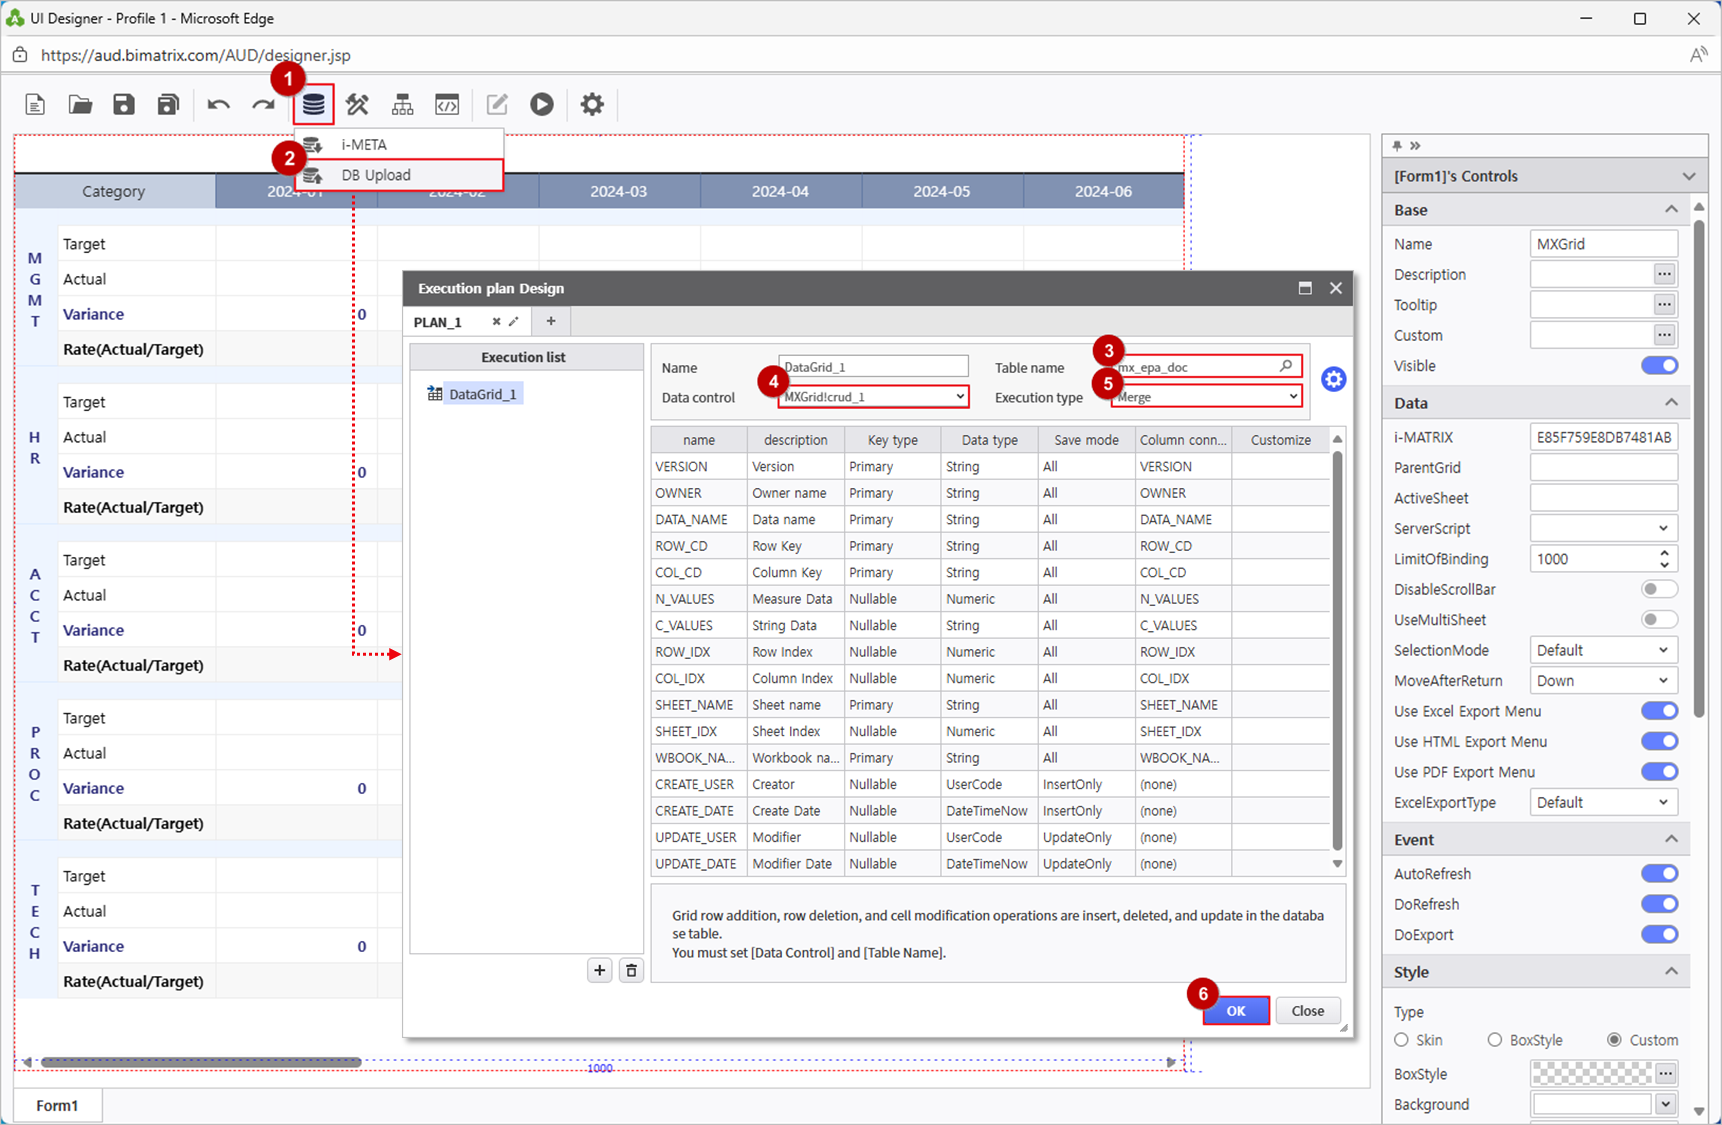
- DB Bot > DB Upload를 클릭해 실행 계획을 등록합니다.
- '테이블 명'을 찾아 입력하고, 저장할 데이터를 입력한 '데이터 컨트롤'을 선택하면 자동으로 컬럼 연결이 설정됩니다. '실행 유형'은 'Merge'를 선택합니다.
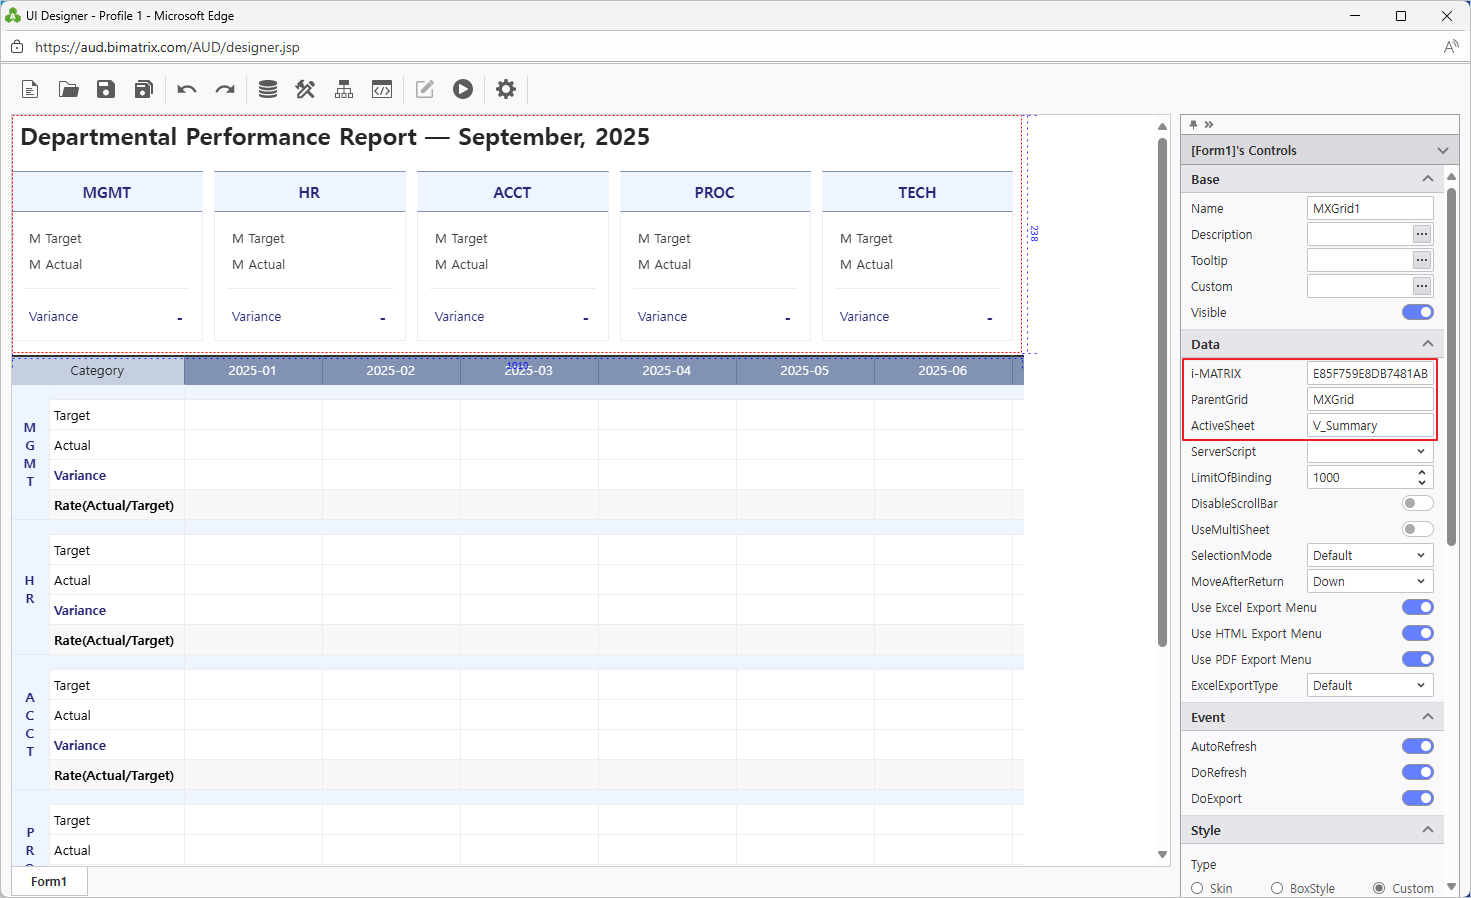
- 앞서 배치한 'MXGrid'의 우측 속성 영역 > Data > i-MATRIX에 입력된 코드를 복사하여 새로 배치한 'MXGrid1'의 동일 위치에 붙여 넣습니다.
- 'ParentGrid'에는 앞서 배치한 'MXGrid'의 Name을 입력합니다. ActiveSheet에는 화면에 나타낼 시트명을 입력하는 부분입니다. 'V_부서별 요약'을 입력합니다.
- 데이터 저장을 하기 위한 설정이 완료됐습니다. 이제 입력한 데이터를 DB에 저장하고, 저장된 데이터를 조회하는 버튼을 설정해 보겠습니다.
- UI Bot > Button에서 버튼 2개를 추가해 알맞은 위치에 배치합니다.
- '저장'과 '조회' 버튼을 구분하기 위해 컴포넌트의 이름을 변경합니다.
'저장' : BTN_SAVE
'조회On the ‘V_Summary’ sheet, display the data entry screen title in the top-left corner.
Formula : ="Departmental Performance Report — " & TEXT(DATE(LEFT(VS_YM, 4), RIGHT(VS_YM, 2), 1), "mmmm") & ", " & YYYY - The report setup and save are now complete. Return to the i-AUD Designer screen.
하나의 MXGrid의 서로 다른 V시트를 동시에 한 화면에 나타내기 위해 UI Bot > MXGrid를 클릭해 추가합니다.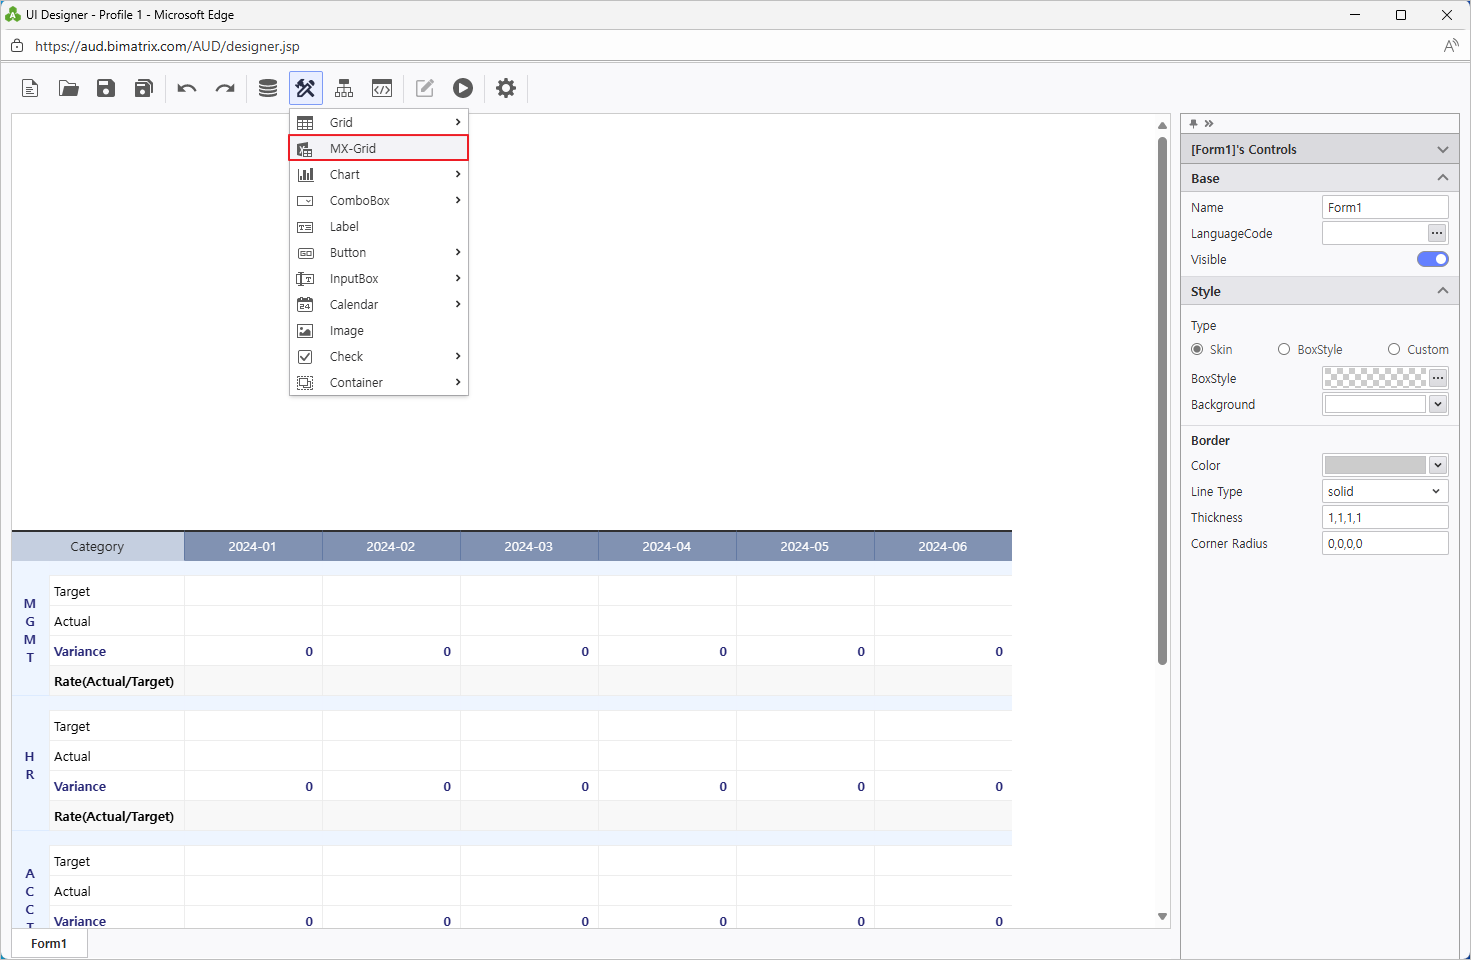
앞서 배치한 'MXGrid'의 ActiveSheet에는 'V_부서별 예산관리'를 입력합니다.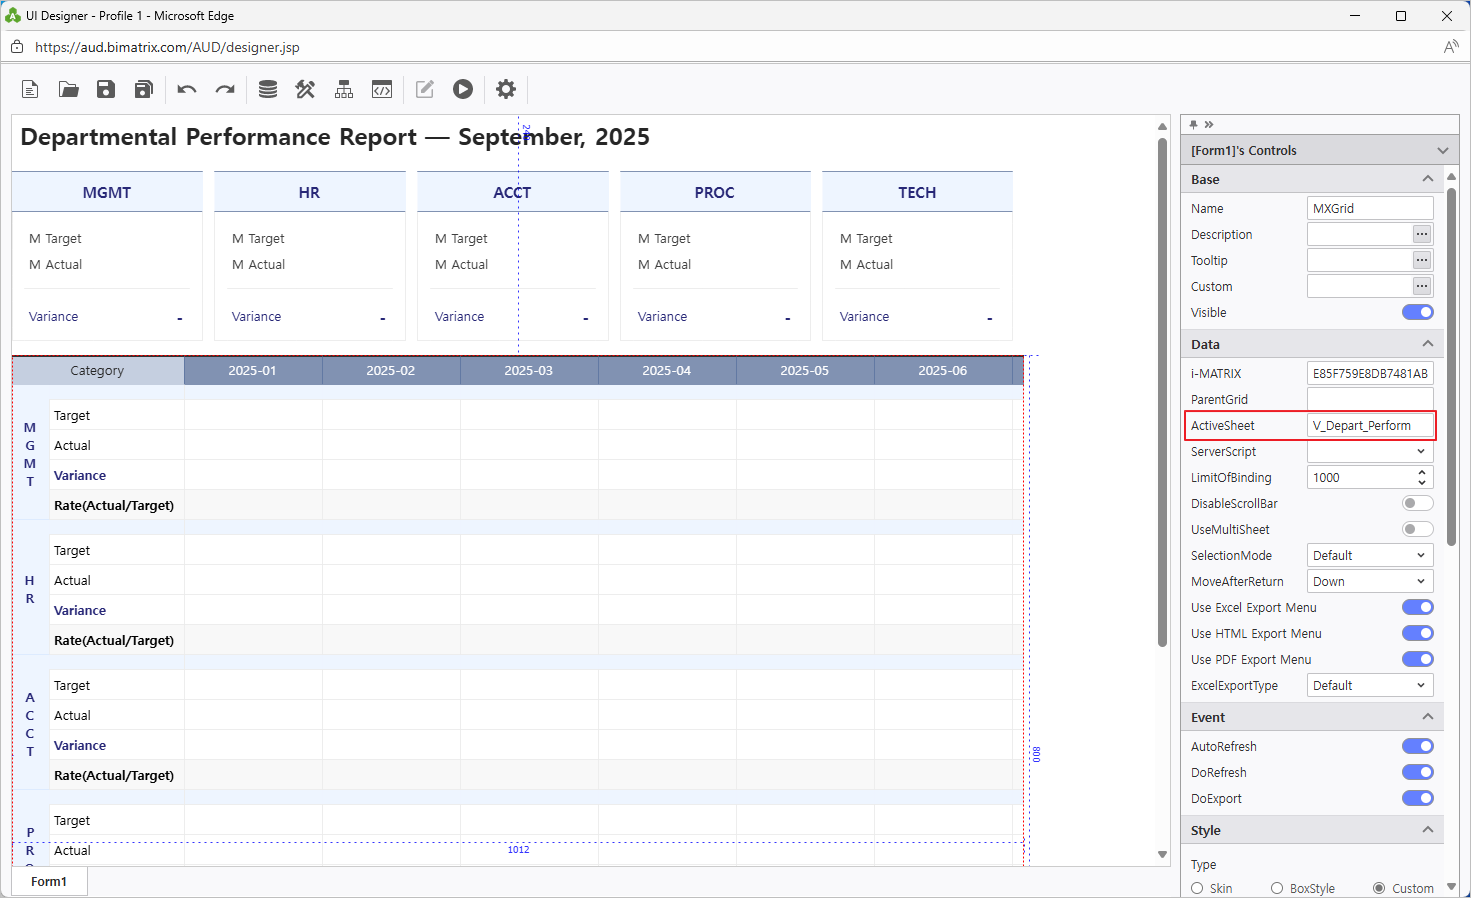
Step 3. Connect to the DB for data storage and configure buttons
In AUD Designer, double-click an empty cell in the data area and enter a number. Verify that the value is entered and totals are calculated automatically.
- To save the entered data to the database, connect to the DB and configure the Save and Retrieve buttons.
- Go to DB Bot > DB Upload and register an execution plan.
- Enter the ‘Table Name’ and select the ‘Data Control’ containing the data to be saved. Then, columns will be automatically mapped.
- Set ‘Execution Type’ to ‘Merge’.
- To display different V sheets in a single MXGrid, add a new MXGrid from UI Bot > MXGrid.
- Copy the code entered in the i-MATRIX property under Data of the previously placed ‘MXGrid’ and paste it into the same location for the newly added ‘MXGrid1’.
- Set ‘ParentGrid’ to the name of the first MXGrid.
- Set ActiveSheet to the sheet you want to display. Enter ‘V_Summary’ to new MXGrid1.
- Enter ‘V_Depart_Perform’ to previously placed MXGrid.
- The setup for saving data is complete.
- Now, let's save the entered data to the DB and set up a button to retrieve the saved data.
- Add two buttons from UI Bot > Button and place them in appropriate positions.
- Rename the buttons to distinguish their functions.
'Save' : BTN_SAVE
'Refresh' : BTN_REFRESH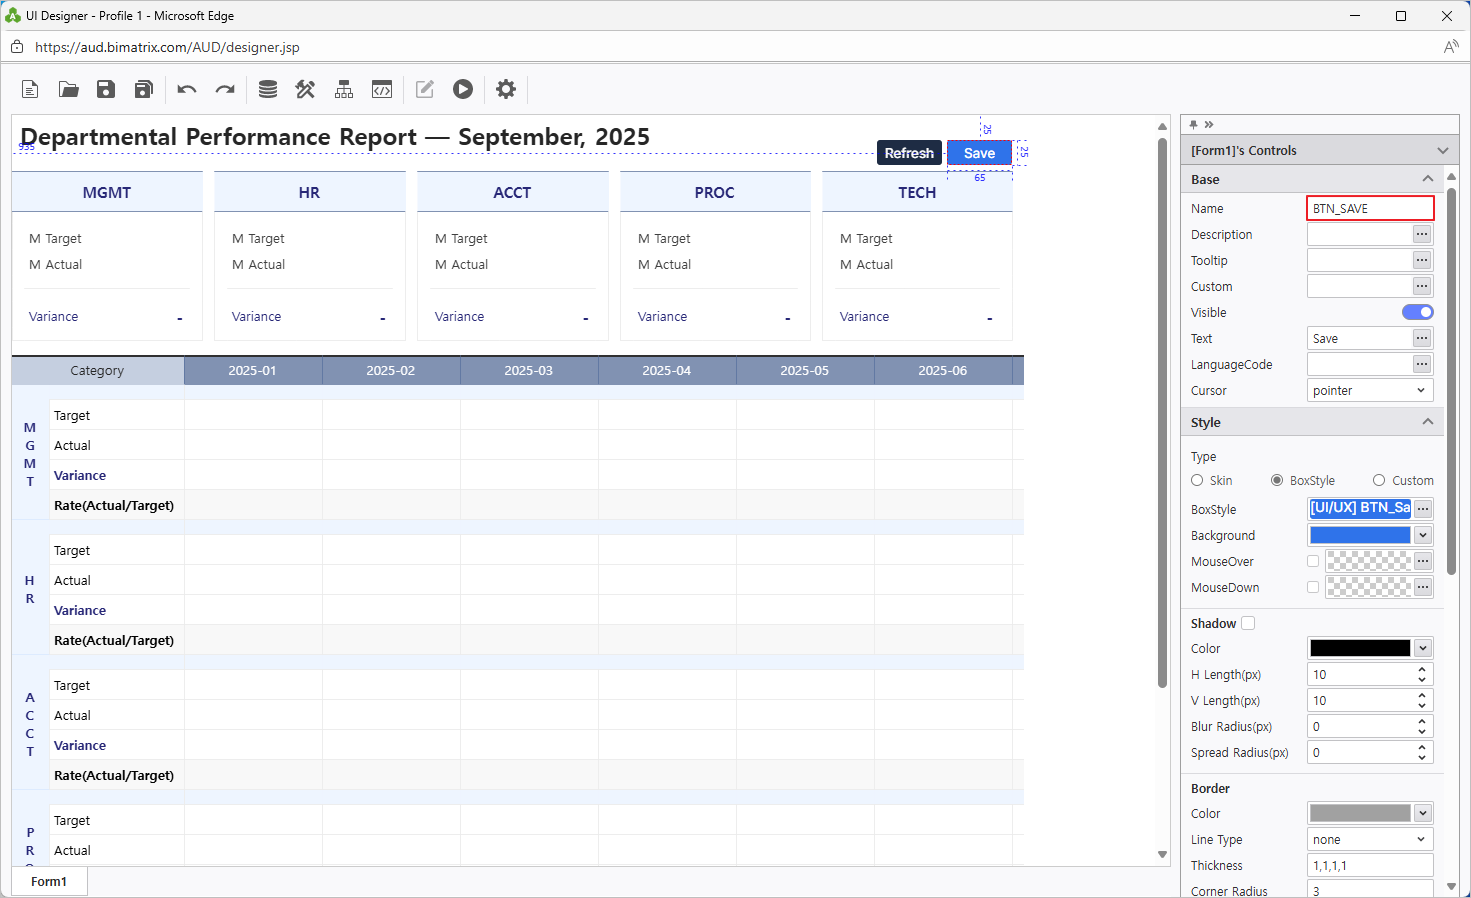
- Process Bot을 활용하여 버튼에 동작을 설정합니다Use Process Bot to assign actions to the buttons.
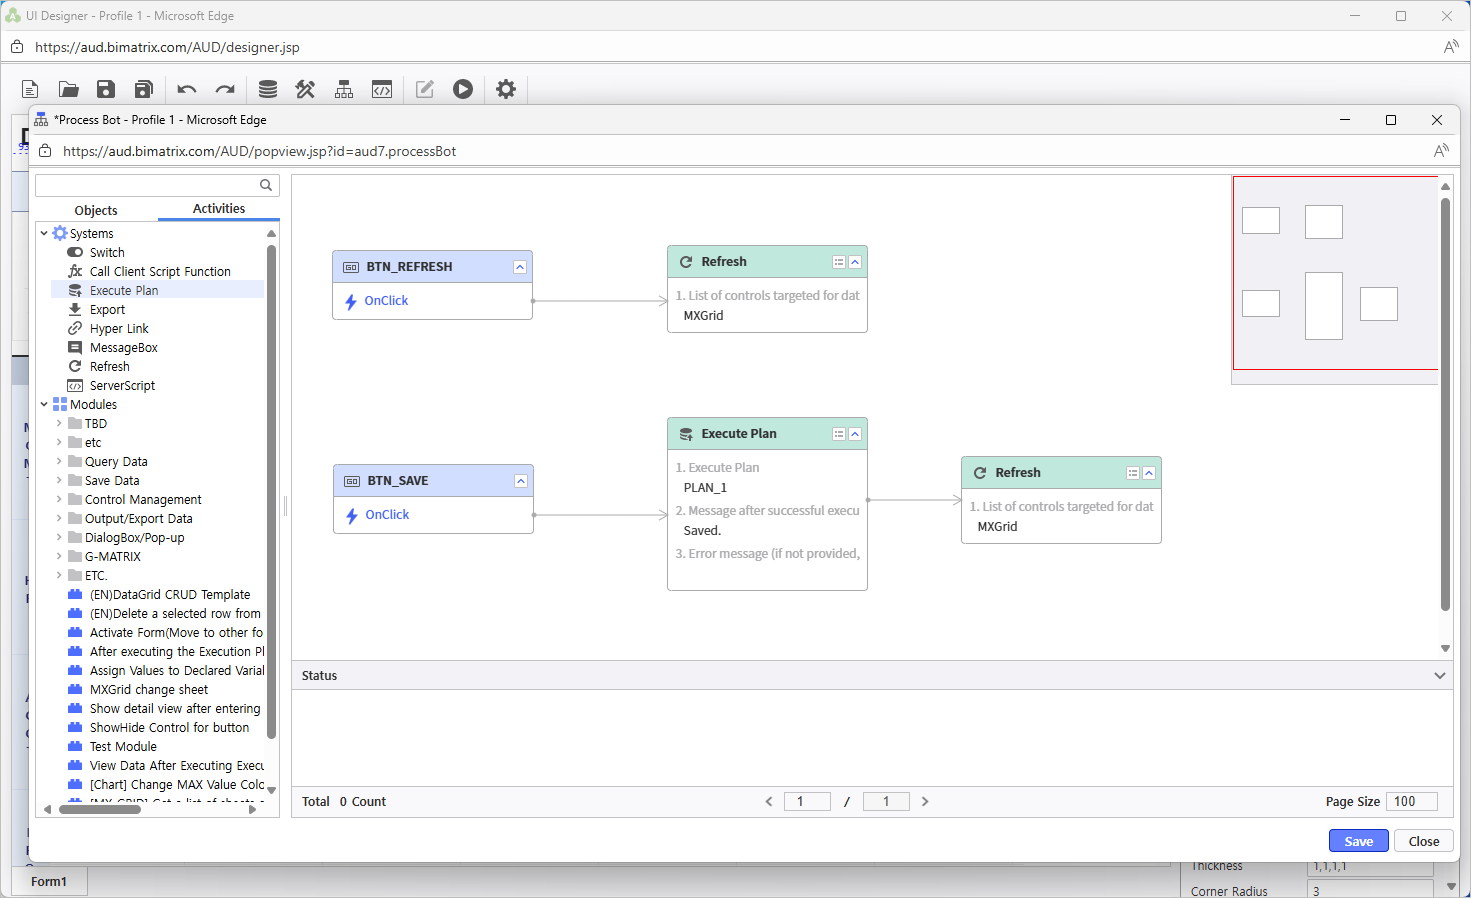
- 데이터를 조회, 입력할 날짜 선택을 위해 Add a year-month calendar using UI Bot > Calendar > Month를 클릭하여 년월 캘린더를 배치합니다.엑셀의 이름 정의된 셀과 연계하여 데이터를 조회하기 위해 Name을 VS_YM으로 설정합니다.
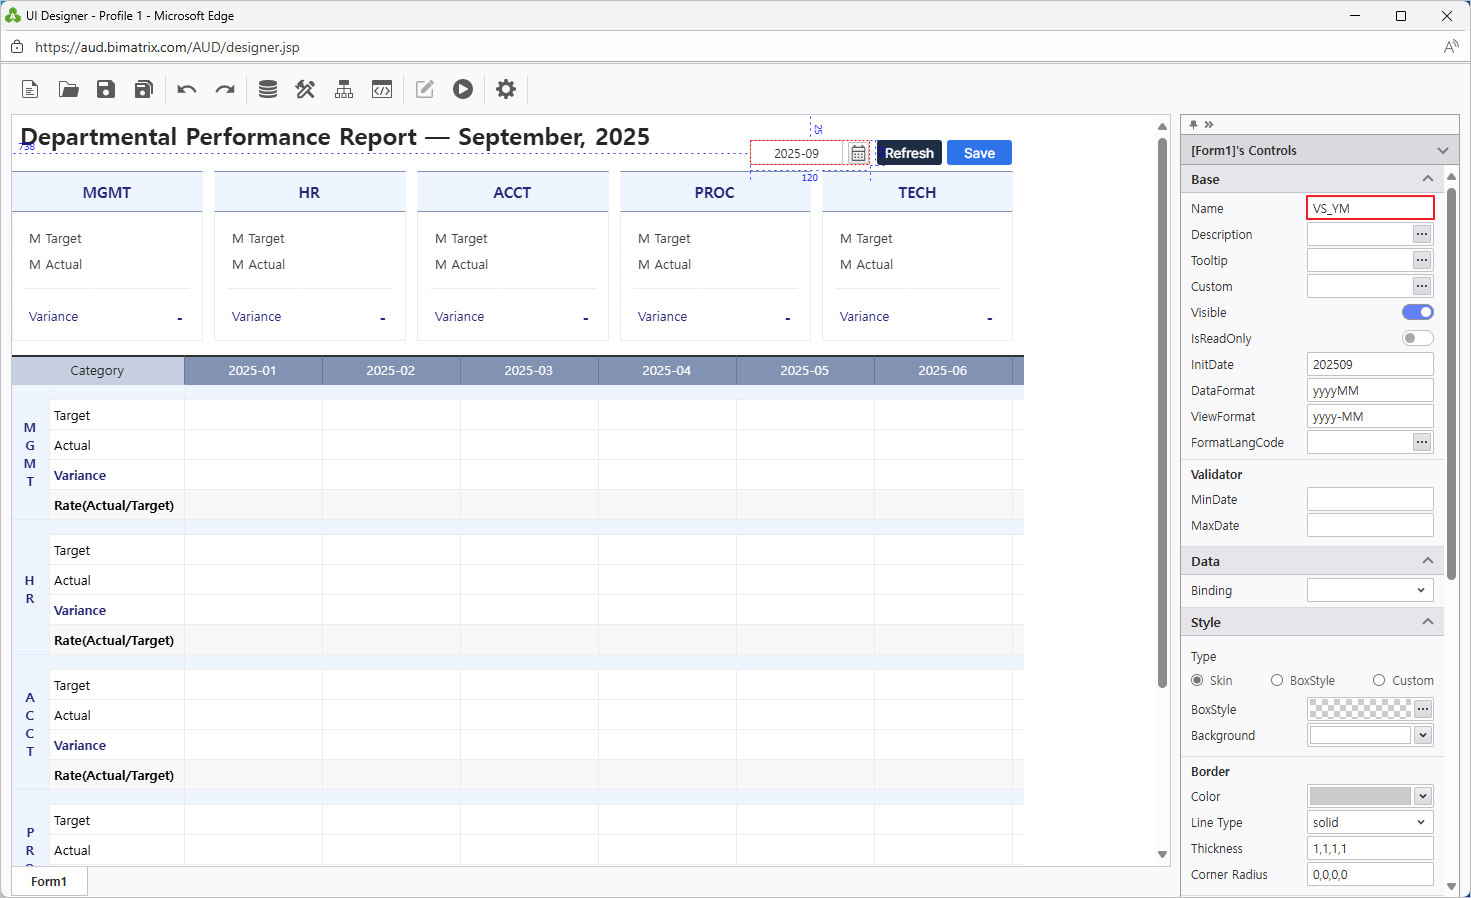
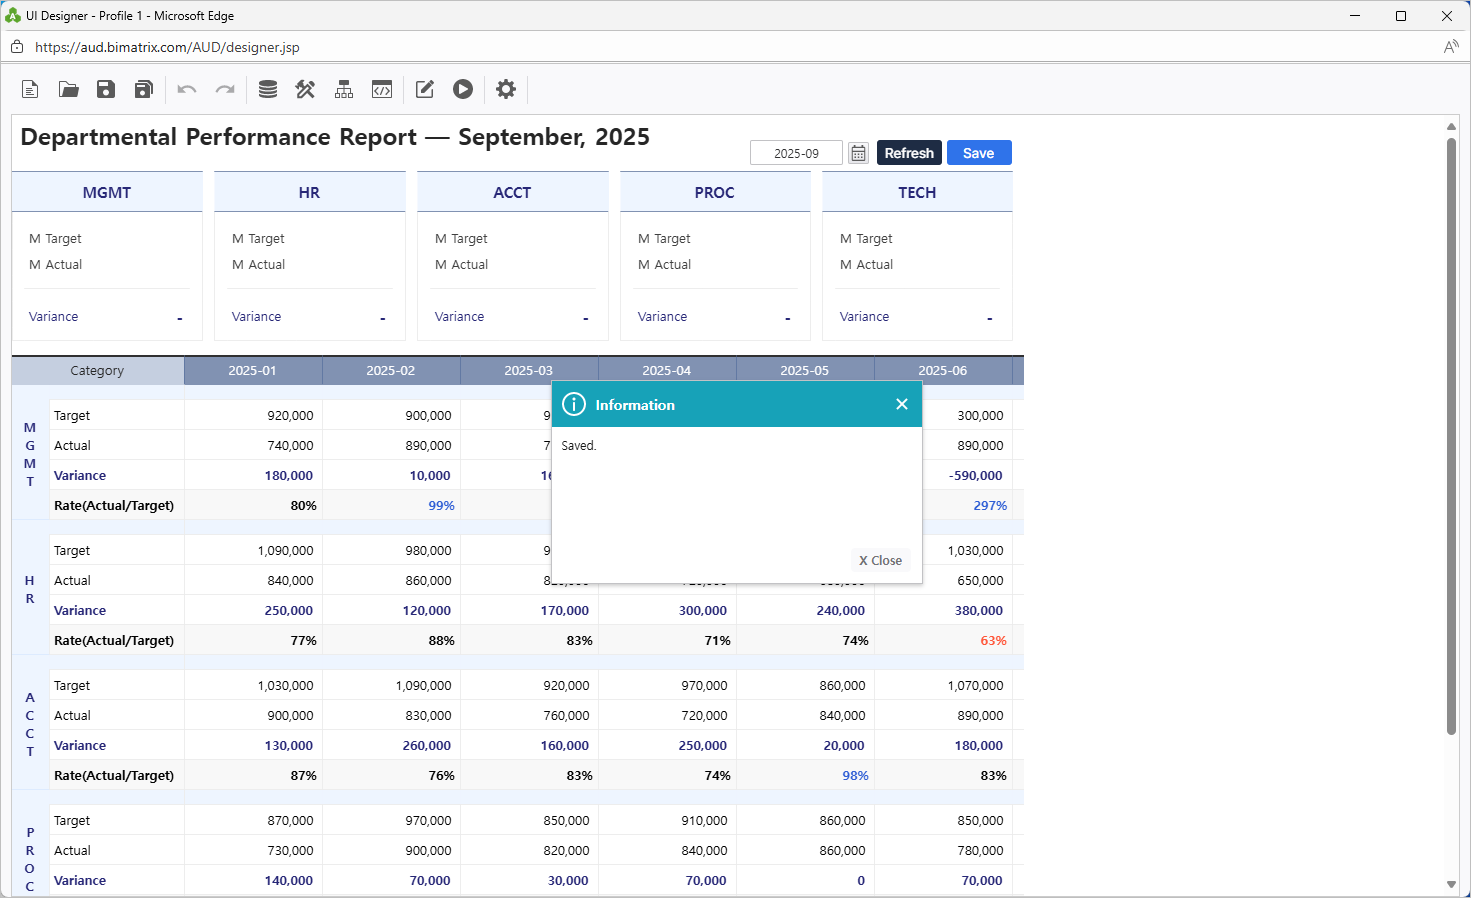
데이터를 입력하고 '저장' 버튼을 클릭하면 데이터가 저장되는 것을 확인할 수 있습니다Month. - Link it to the Excel named cell by setting Name to VS_YM so that data can be retrieved based on the selected month.
- Once this is set up, entering data and clicking the ‘Save’ button will store the data in the database, and the 'Refresh' button will fetch the stored data.
Step 4.
...
Save your report
- Save the completed report to My Folder.
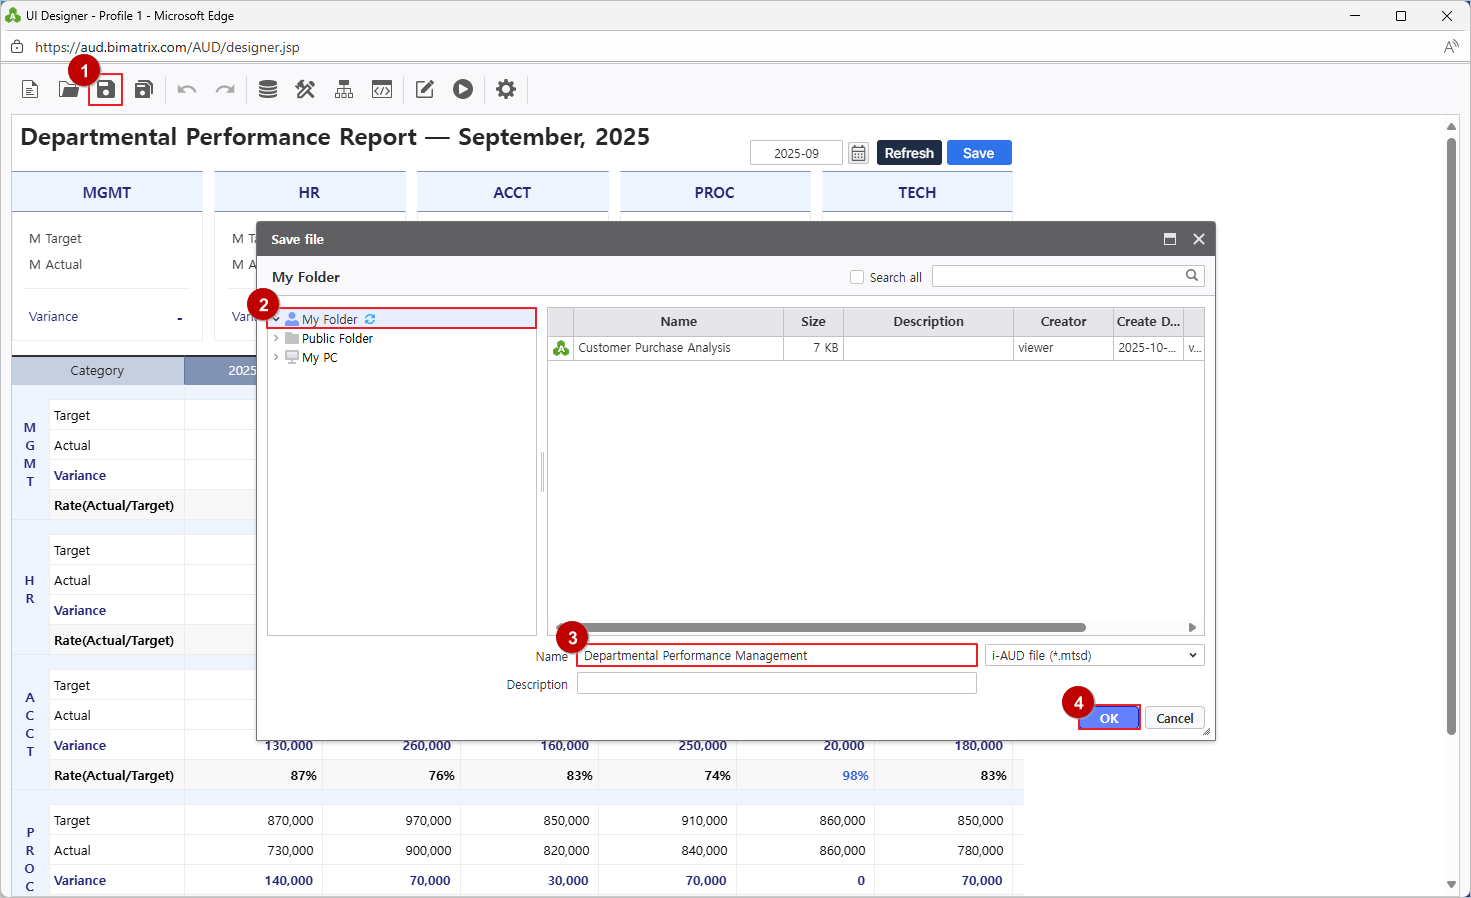
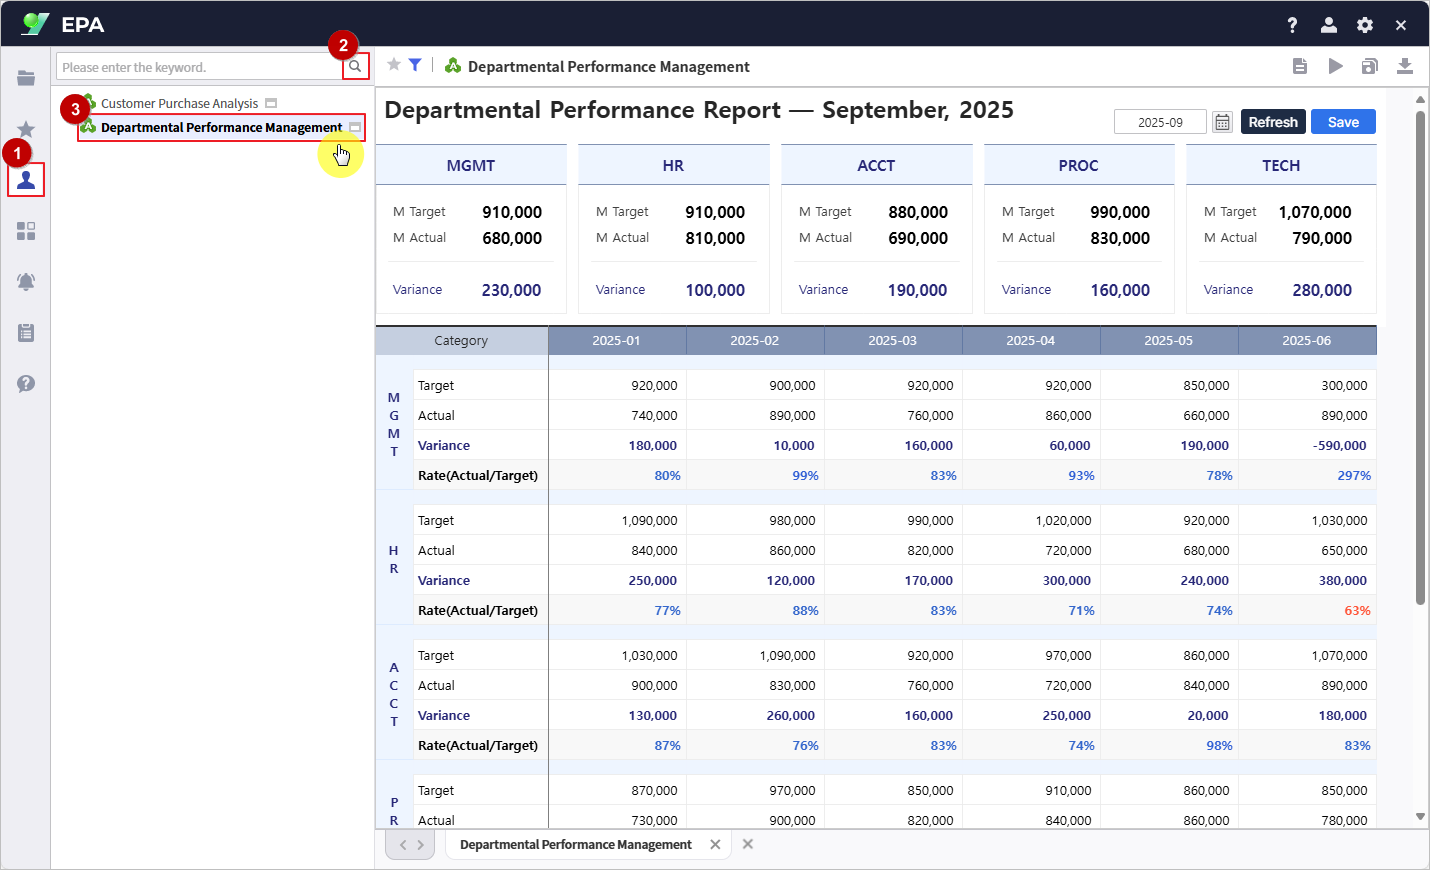
EPA 사이트 메인 화면 좌측 [메뉴From the EPA main screen, go to [Menu] > [개인]을 선택합니다.
'돋보기' 버튼을 클릭해 보고서 목록을 새로 고침 하면 저장된 보고서를 확인할 수 있습니다.
웹에서 데이터를 입력하고 저장해 팀원들과 함께 공유해 보세요Individual] in the left-hand sidebar.
Click the Search(Magnifying glass icon) button to refresh the report list and confirm your saved report.
Enter data on the web and save it to share with your team.
- Save the completed report to My Folder.