...
This menu provides options for configuring the visible aspects of the Olap-Grid screen.


< Olap-Grid Design (Option) - Detailed Description >
| Category | Subcategory | Description | |||||||||||||||||||||||||||||||||||
|---|---|---|---|---|---|---|---|---|---|---|---|---|---|---|---|---|---|---|---|---|---|---|---|---|---|---|---|---|---|---|---|---|---|---|---|---|---|
| Totals |
| ||||||||||||||||||||||||||||||||||||
| Hide Subtotal for Single Item | Sets whether to display subtotals when there is only one item to subtotal | ||||||||||||||||||||||||||||||||||||
| Show Total for Columns | Sets whether to configure subtotals/totals for column area | ||||||||||||||||||||||||||||||||||||
| Position of Subtotal for Columns | The position of the subtotal in the column area | ||||||||||||||||||||||||||||||||||||
| Position of Column Grand Total | The position of the grand total in the column area | ||||||||||||||||||||||||||||||||||||
| Grand Total for Columns Texts | The text displayed for the grand total in the column area | ||||||||||||||||||||||||||||||||||||
| Texts for the Subtotal for Columns | The text displayed for the subtotal in the column area | ||||||||||||||||||||||||||||||||||||
| Show Total for Row | Sets whether to configure subtotals/totals for row area | ||||||||||||||||||||||||||||||||||||
| Position of Subtotal for Rows | The position of the subtotal in the row area | ||||||||||||||||||||||||||||||||||||
| Position of Grand Total for Rows | The position of the grand total in the row area | ||||||||||||||||||||||||||||||||||||
| Texts for the Grand Total for Rows | The text displayed for the grand total in the row area | ||||||||||||||||||||||||||||||||||||
| Texts for the Subtotal for Rows | The text displayed for the subtotal in the row area | ||||||||||||||||||||||||||||||||||||
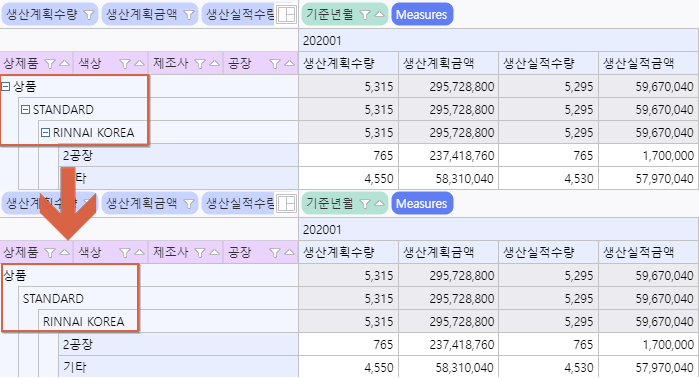
| Action | Auto-Expansion | Sets whether to expand fields automatically on initial loading Set to True : Expands all, Disbale True : Collapses all
| |||||||||||||||||||||||||||||||||||
| Chart Source | Sets whether to display subtotals and grand totals in charts linke to the Olap-Grid
| ||||||||||||||||||||||||||||||||||||
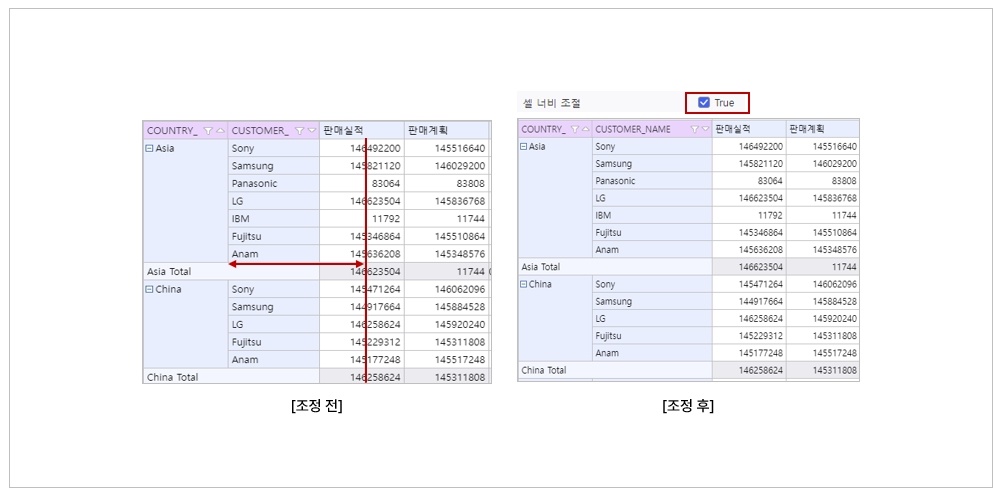
| Draggable for Cell Width | Sets to allow adjusting spacing by dragging cell boundaries Sets whether to activage cell width adjustment functionality
| ||||||||||||||||||||||||||||||||||||
| Viewer Type | Sets the display method for meta item placed in the horizontal area (Default, TreeView)
| ||||||||||||||||||||||||||||||||||||
| Max Depths for Chart Label Field | The number of field hierarchy levels to be displayed in the chart label - Analysis items are displayed starting from the highest dimension (Located at the front) - Displays all levels of the hierarchy when its value is ‘-1’
| ||||||||||||||||||||||||||||||||||||
| Enable Column's Sort | Sets whether to activate the display of the sort button on the header cells of fields placed in the Column area. | ||||||||||||||||||||||||||||||||||||
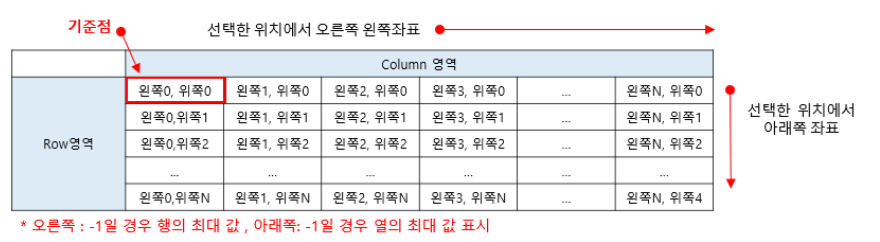
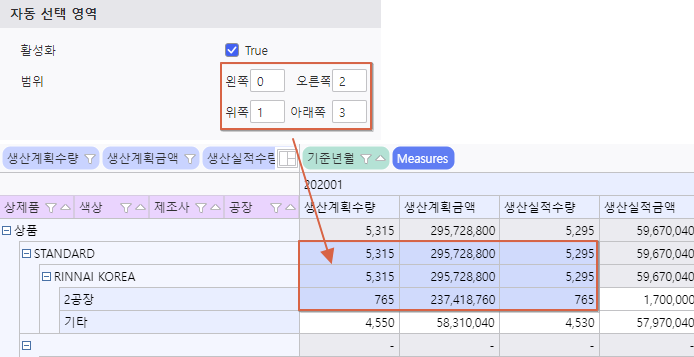
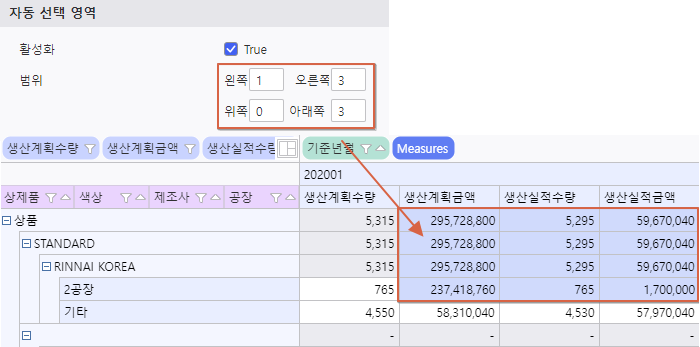
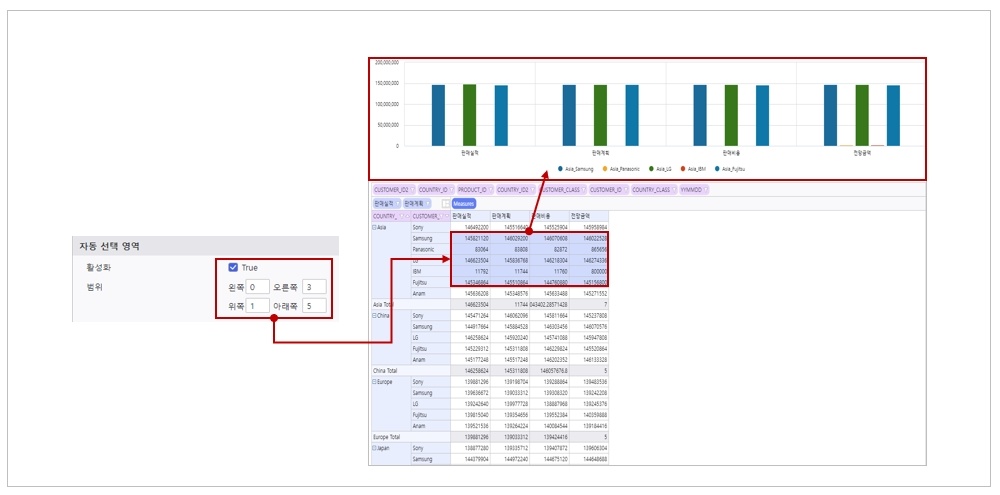
| Auto Selection Area | Enable | Sets whether to activate Auto Seletion Area feature
| |||||||||||||||||||||||||||||||||||
| Range | Sets the selection range for the Auto Selection Area
| ||||||||||||||||||||||||||||||||||||
Design |
| ||||||||||||||||||||||||||||||||||||
Show Expand Button | Show / Hide data expansion button
| ||||||||||||||||||||||||||||||||||||
| Scroll Bar Style | Sets the style of the Olap-Grid's scrollbar | ||||||||||||||||||||||||||||||||||||
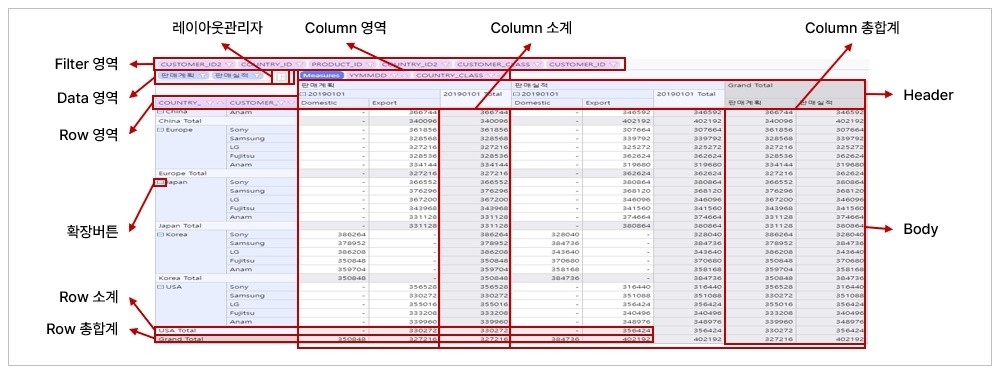
| Position of Values Header | Sets the placement area of value fields
| ||||||||||||||||||||||||||||||||||||
| Distinguishing Name for Row Area | Sets the text for the row area | ||||||||||||||||||||||||||||||||||||
| Distinguishing Name for Column Area | Sets the text for the column area | ||||||||||||||||||||||||||||||||||||
| Distinguishing Name for Values Area | Sets the text for the data area | ||||||||||||||||||||||||||||||||||||
| Distinguishing Name for Filter Area | Sets the text for the filter area | ||||||||||||||||||||||||||||||||||||
| Row Height | Sets the item height of row area (Header : header area / Body : data area) | ||||||||||||||||||||||||||||||||||||
| Visibility of Area | Selects the areas to be displayed in the Olap Grid | ||||||||||||||||||||||||||||||||||||
| Texts for Null Cells | Sets the text to substitute when data values are null | ||||||||||||||||||||||||||||||||||||
| Texts for Invalid Cells | Sets the text to dispaly in invalid cells | ||||||||||||||||||||||||||||||||||||
| Texts for Division by Zero Error | Sets the text to display in cells that result from a divide-by-zero error | ||||||||||||||||||||||||||||||||||||
| Texts for Error Cells | Sets the text to display in cells with data errors | ||||||||||||||||||||||||||||||||||||
| Align Vertically (Row Headers) | Sets the header position for the row area | ||||||||||||||||||||||||||||||||||||
| Align Vertically(Column Headers) | Sets the header position for the column area | ||||||||||||||||||||||||||||||||||||


...