| 구분Category상세 구분 | Subcategory | 상세 설명Description |
|---|
| 합계 값Totals |
| 패널 |
|---|
| borderStyle | solid |
|---|
| title | 합계 값 영역 설정 옵션Total Value Area Configuration Option |
|---|
|
| 펼치기 |
|---|
| title | 클릭하여 상세 설명 보기Click to View Detailed Information |
|---|
|
| 참고사항 |
|---|
| title | 합계 값 영역 설정 옵션Total Value Area Configuration Option |
|---|
| - Olap-Grid의 합계는 소계와 총합계로 구성되며, Grid totals consist of subtotals and grand totals, with aggregation settings for each Row / Column 별로 각각 집계값 설정
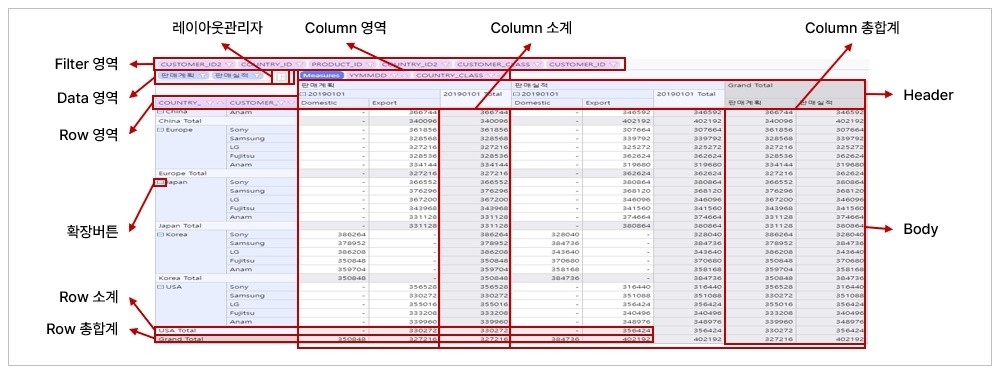
Filter 영역 | 특정조회조건을 필요로 하는
분석항목 영역 | Column 영역 | 분석항목의 배치가 가로 부분에
해당되는 영역 | 총합계 | 전체 분석차원의 메저 총합계 |
|---|
Data 영역 | 메저 항목이 보여지는 영역 | 레이아웃 관리자 | 분석항목들의 배치 영역 설정 관리 | Header | 차원항목이 보이는 영역 |
|---|
Row 영역 | 분석항목의 배치가 세로 부분에
해당되는 영역 | 소계 | 각 분석차원의 메저 부분 합 | Body | 데이터가 보이는 영역 |
|---|
|
|
|
|
| 단일 항목 소계 숨기기 | 소계 할 항목이 1개일 때 소계 표시 여부 |
| Column 합계 표시 | 열 영역 소계 / 합계 설정 여부 |
| Column 소계 위치 | 열 영역 소계 위치 |
| Column 총합계 위치 | 열 영역 총합계 위치 |
| Column 총합계 텍스트 | 열 영역 총합계 문구 |
| Column 소계 텍스트 | 열 영역 소계 문구 |
| Row 합계 표시 | |
| Row 소계 위치 | 행 영역 소계 위치 |
| Row 총합계 위치 | 행 영역 총합계 위치 |
| Row 총합계 텍스트 | 행 영역 총합계 문구 |
| Row 소계 텍스트 | 행 영역 소계 문구 |
동작
자동 확장 | 초기 로딩 시 필드 자동 확장 여부 설정
True 설정 : 전체 확장, True 해제 : 전체 축소Area | The area for analysis items that require specific query conditions | Column Area | The area where analysis items are horizontally arranged | Grand Total | The grand total of measures across all analysis dimensions |
|---|
Data Area | The area where measure items are displayed | Layout Manager | Manages the arrangement settings for analysis items | Header | The area where dimension items are visible |
|---|
Row Area | The area where dimension items are viertically arranged | Subtotal | Subtotal of measures for each analysis dimension | Body | The area where data is visible |
|---|
|
|
|
|
| Hide Subtotal for Single Item | Sets whether to display subtotals when there is only one item to subtotal |
| Show Total for Columns | Sets whether to configure subtotals/totals for column area |
| Position of Subtotal for Columns | The position of the subtotal in the column area |
| Position of Column Grand Total | The position of the grand total in the column area |
| Grand Total for Columns Texts | The text displayed for the grand total in the column area |
| Texts for the Subtotal for Columns | The text displayed for the subtotal in the column area |
| Show Total for Row | Sets whether to configure subtotals/totals for row area |
| Position of Subtotal for Rows | The position of the subtotal in the row area |
| Position of Grand Total for Rows | The position of the grand total in the row area |
| Texts for the Grand Total for Rows | The text displayed for the grand total in the row area |
| Texts for the Subtotal for Rows | The text displayed for the subtotal in the row area |
Action
| Auto-Expansion | Sets whether to expand fields automatically on initial loading Set to True : Expands all, Disbale True : Collapses all | 패널 |
|---|
| borderStyle | solid |
|---|
| title | 자동 확장 상세 정보Detailed Information for Auto-Expansion |
|---|
|
| 펼치기 |
|---|
| title | 클릭하여 상세 설명 보기Click to View Detailed Information |
|---|
|
| 참고사항 |
|---|
| - Olap-Grid 구조를 트리 구조의 형태로 변환하거나 전체 항목을 확장하여 조회하도록 설정
 Image Removed Image Removed
|
|
|
|
차트 소스 | Olap-Grid와 연결된 차트에 소계, 총계 표현 여부 설정| Detailed Information for Auto-Expansion |
| - Configures the Olap-Grid structure to be displayed as a tree view or to expand all items for viewing.
Image Added |
|
|
|
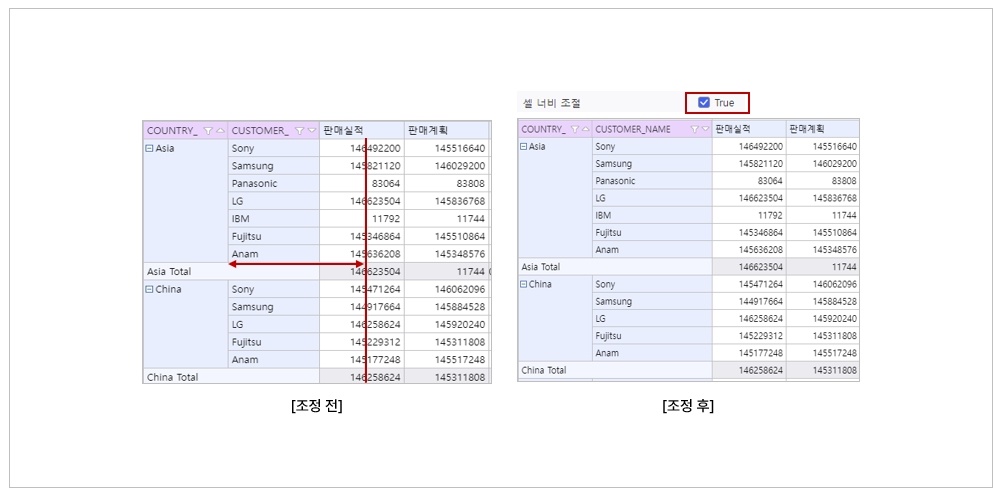
| Chart Source | Sets whether to display subtotals and grand totals in charts linke to the Olap-Grid 셀의 경계를 드래그하여 간격 조정을 할 수 있도록 설정 셀 너비 조절 기능 활성화 여부 설정| 패널 |
|---|
| borderStyle | solid |
|---|
| title | 차트 소스 상세 정보Detailed Information for Chart Source |
|---|
|
| 펼치기 |
|---|
| title | 클릭하여 상세 설명 보기Click to View Detailed Information |
|---|
|
| 참고사항 |
|---|
|  Image Removed Image Removed
|
|
|
| 셀 너비 조절 | | Detailed Information for Chart Source |
| - Controls whether subtotal or grand total data are displayed on the chart
Image Added |
|
|
|
| Draggable for Cell Width | Sets to allow adjusting spacing by dragging cell boundaries Sets whether to activage cell width adjustment functionality | 패널 |
|---|
| borderStyle | solid |
|---|
| title | 셀 너비 조절 상세 정보Detailed Information for Draggable Cell Width |
|---|
|
| 펼치기 |
|---|
| title | 클릭하여 상세 설명 보기Click to View Detailed Information |
|---|
|
| 참고사항 |
|---|
| 셀의 경계를 드래그하여 간격 조정을 할 수 있도록 설정| Detailed Information for Draggable Cell Width |
| - Sets to allow adjusting spacing by dragging cell boundaries
|
|
|
|
| Viewer 유형가로 영역에 배치된 메타항목 표현 방식 설정 Type | Sets the display method for meta item placed in the horizontal area (Default, TreeView) | 패널 |
|---|
| borderStyle | solid |
|---|
| title | Viewer 유형 상세 정보Detailed Information for Viewer Type |
|---|
|
|
|
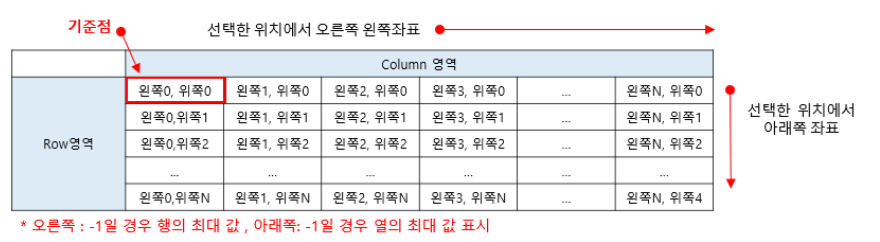
| 차트 레이블 필드 최대 계층 수 | 차트 레이블에 표시 될 필드 계층 수 - 분석항목은 상위 차원(맨 앞에 위치) 항목부터 표현됨 - ‘-1’의 경우 모든 계층 표현됨Max Depths for Chart Label Field | The number of field hierarchy levels to be displayed in the chart label - Analysis items are displayed starting from the highest dimension (Located at the front) - Displays all levels of the hierarchy when its value is ‘-1’ | 자동선택 영역 | 활성화 | 자동 선택 영역 기능 활성화 여부 설정
범위 | 자동 선택 영역 선택 범위 설정| 패널 |
|---|
| borderStyle | solid |
|---|
| title | 차트 레이블 필드 최대 계층 수 상세 정보Detail Information for Max Depths for Chart Label Field |
|---|
|
| 펼치기 |
|---|
| title | 클릭하여 상세 설명 보기Click to View Detailed Information |
|---|
|
| 참고사항 |
|---|
| title | 차트 레이블 필드 최대 계층 수 상세 정보 |
|---|
|  Image Removed Image Removed
|
|
|
|
| Column 정렬 활성화 | Column 영역에 배치된 필드의 헤더 셀의 정렬 버튼 표시 활 성화 여부 |
| Detailed Information for Max Depths for Chart Lable Field |
| - Defines the number of analysis dimensions that can be displayed in the chart
Image Added |
|
|
|
| Enable Column's Sort | Sets whether to activate the display of the sort button on the header cells of fields placed in the Column area. |
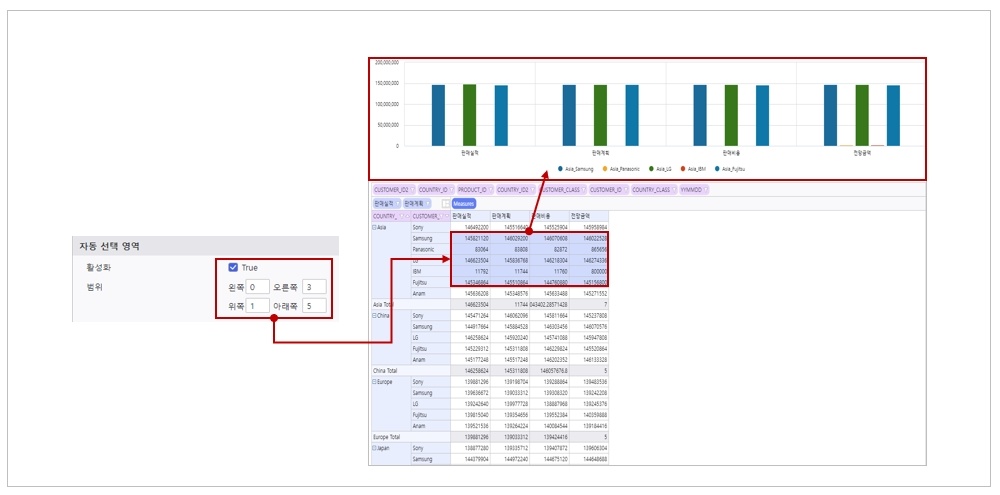
| Auto Selection Area | Enable | Sets whether to activate Auto Seletion Area feature
|
| Range | Sets the selection range for the Auto Selection Area | 패널 |
|---|
| borderStyle | solid |
|---|
| title | 범위 상세 정보Detailed Information for Range |
|---|
|
| 펼치기 |
|---|
| title | 클릭하여 상세 설명 보기Click to View Detailed Information |
|---|
|
| 참고사항 |
|---|
| 자동선택 영역 범위 설정 방법| Detailed Information for Range |
| - How to set the Auto Selection Area range
Ex 1. 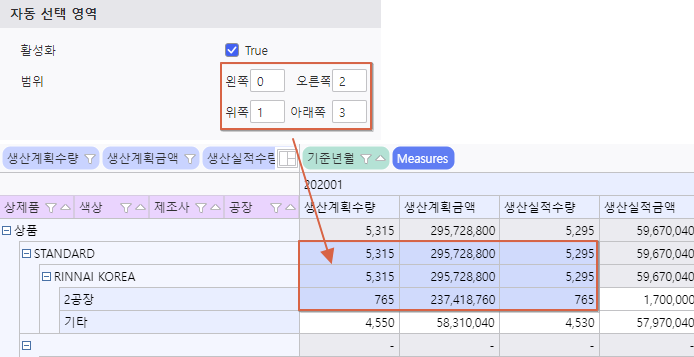
Ex 2. 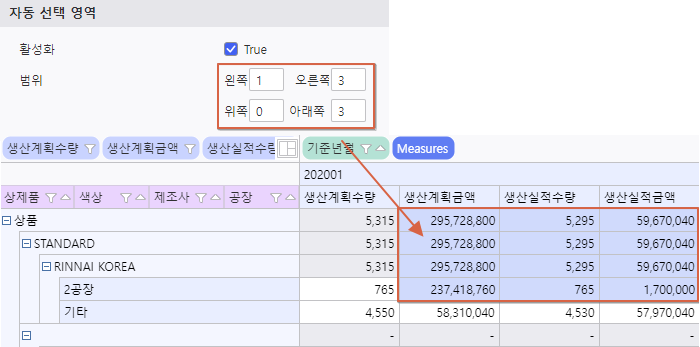
- 초기 로드 시 선택된 영역으로 차트 생성Chart is generated with the selected area on initial load
|
|
|
|
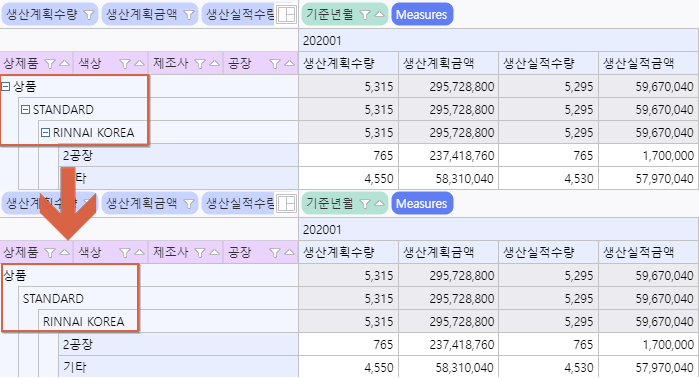
디자인Design
|
| 패널 |
|---|
| borderStyle | solid |
|---|
| title | 디자인 상세 정보Detailed Information for Design |
|---|
|
| 펼치기 |
|---|
| title | 클릭하여 상세 설명 보기Click to View Detailed Information |
|---|
|
| 참고사항 |
|---|
| title | 디자인 상세 정보 | Detailed Information for Design |
|---|
| - Sets Olap-Grid 화면 영역 명칭, 영역 표시, 값 표시 방법 등 설정
- 세로 정렬은 여러 행이 병합된 셀에만 적용
 Image Removed Image Removed
|
|
|
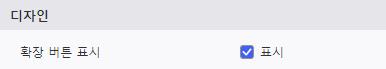
| 확장 버튼 표시 | 데이터 확장 버튼 보이기 / 숨기기- screen area names, area display, value display method, etc.
- Vertical alignment is applied only to cells that merge multiple rows
Image Added |
|
|
|
Show Expand Button | Show / Hide data expansion button | 패널 |
|---|
| borderStyle | solid |
|---|
| title | 확장 버튼 표시 상세 정보Detailed Information for Show Expand Button |
|---|
|
| 펼치기 |
|---|
| title | 클릭하여 상세 설명 보기Click to View Detailed Information |
|---|
|
| 참고사항 |
|---|
| 헤더 영역의 데이터 확장 버튼 생성 여부 설정| Detailed Information for Show Expand Button |
| - Sets whether to create data expansion buttons in the header area
|
|
|
|
| 스크롤바 스타일 | Olap-Grid의 스크롤바 스타일 설정 여부 |
|
| 값 헤더 생성위치 | 값 필드의 배치 영역 설정Scroll Bar Style | Sets the style of the Olap-Grid's scrollbar |
| Position of Values Header | 세로 정렬(Column 헤더) | 열 영역의 헤더 위치 설정Sets the placement area of value fields | 참고사항 |
|---|
| - Olap-Grid의 디자인-필드에서 Data 영역에 필드 값이 1개로 세팅 된 후, Data영역에 필드를 2개 이상 지정 시,
값(Measure)헤더의 초기 생성 위치를 Row, Column 중 선택한 위치에 생성해주는 기능입니다.
(최초 Olap-Grid 생성 시, Data 영역에 필드 값이 1개일 경우에만 사용 가능)
|
|
| Row 영역 구분명 | 행 영역 문구 설정 |
| Column 영역 구분 | 열 영역 문구 설정 |
| Data 영역 구분명 | 데이터 영역 문구 설정 |
| Filter 영역 구분명 | 필터 영역 문구 설정 |
| Row 높이 | 행 영역의 항목 높이 설정 (Header : 헤더영역 / Body : 데이터 영역) |
| 영역 표시 | Olap Grid에서 보여질 영역 선택 |
| 값이 Null인 셀 텍스트 | 데이터 값이 없는 경우, 대체할 문구 설정 |
| 유효하지 않은 셀 텍스트 | 유효하지 않는 셀에 표현할 문구 설정 |
| 0으로 나누기 오류 값 | 데이터를 0으로 나눴을 때의 오류 셀에 표현할 문구 설정 |
| 오류 셀 텍스트 | 오류 난 데이터 셀에 표현할 문구 설정 |
| 세로 정렬(Row 헤더) | 행 영역의 헤더 위치 설정 |
| Position of Values Header |
| - This feature allows you to specify the initial position (Row or Column) for the value(Measure) header
when more than one field is added to the Dtat area in the Olap-Grid's Design Field menu, after it was initially set with only on field.
(This option is only available when the Olap-Grid is first created with a single field in the Data area)
|
|
| Distinguishing Name for Row Area | Sets the text for the row area |
Distinguishing Name for Column Area
| Sets the text for the column area |
Distinguishing Name for Values Area
| Sets the text for the data area |
Distinguishing Name for Filter Area
| Sets the text for the filter area |
| Row Height | Sets the item height of row area (Header : header area / Body : data area) |
| Visibility of Area | Selects the areas to be displayed in the Olap Grid |
| Texts for Null Cells | Sets the text to substitute when data values are null |
| Texts for Invalid Cells | Sets the text to dispaly in invalid cells |
| Texts for Division by Zero Error | Sets the text to display in cells that result from a divide-by-zero error |
| Texts for Error Cells | Sets the text to display in cells with data errors |
| Align Vertically (Row Headers) | Sets the header position for the row area |
| Align Vertically(Column Headers) | Sets the header position for the column area |


