...
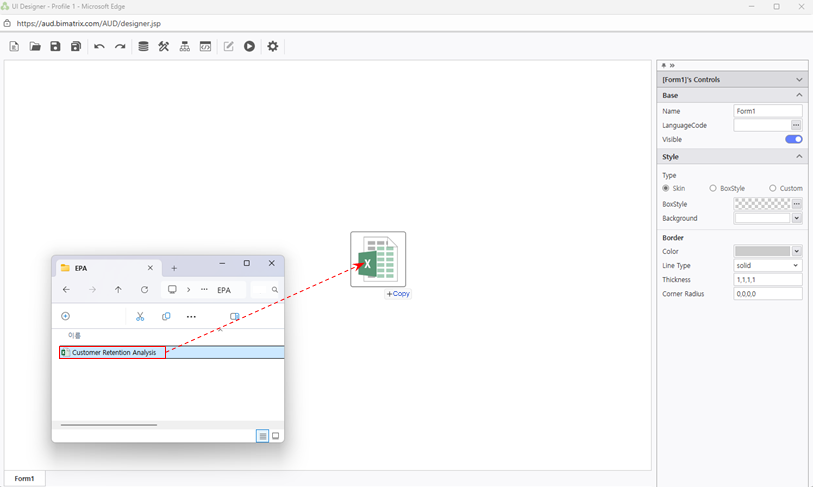
- Download the sample Excel file from the Learning Experience Samples.
From the EPA main screen, go to [Menu] > [ToolsTool] and launch i-AUD Designer.
Drag and drop the saved Excel file into the i-AUD Designer window.
The Excel report now appears in the web view, preserving the original layout.
- When database data is connected, the number of records displayed on the web screen is limited to 1,000 by default. Change this limit to 5,000 as follows:
Data > LimitofBinding : 5000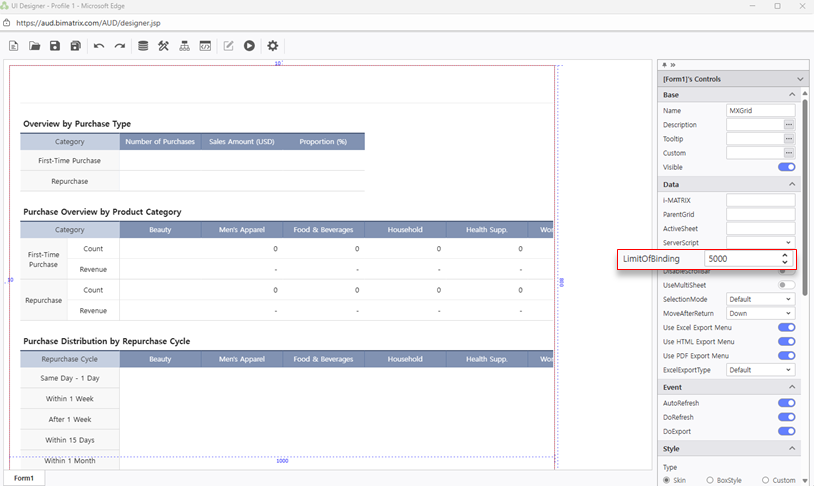
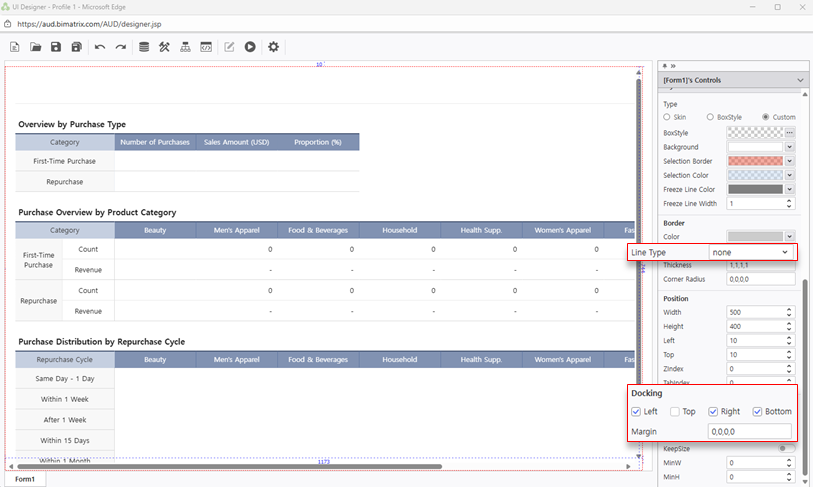
Ensure the report automatically resizes to fit the web browser window.
In the Properties pane on the right, check Docking: Left, Right, Bottom.
To remove the border from the report on the designer screen, set the Line Type property under Border to ‘None’.
- Download the sample Excel file from the Learning Experience Samples.
...
Let’s connect the database so the report data updates automatically — no need to create a new report every month.
Right-click on the report area, then select Design.
Let’ start by understanding the role of each sheet in this report
Sheet V : V_Retention
When multiple sheets exist in Excel, the sheet to be displayed on the web must follow the format ‘V_(letters)’ or ‘V(number)’.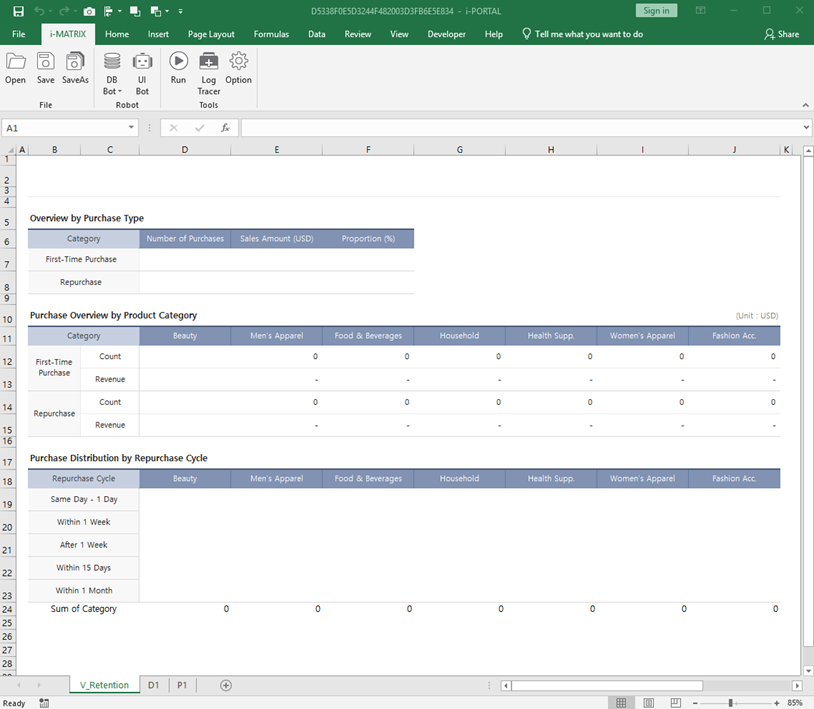
- Sheet D : D1
This sheet allows you to enter data or retrieve it by connecting to a database.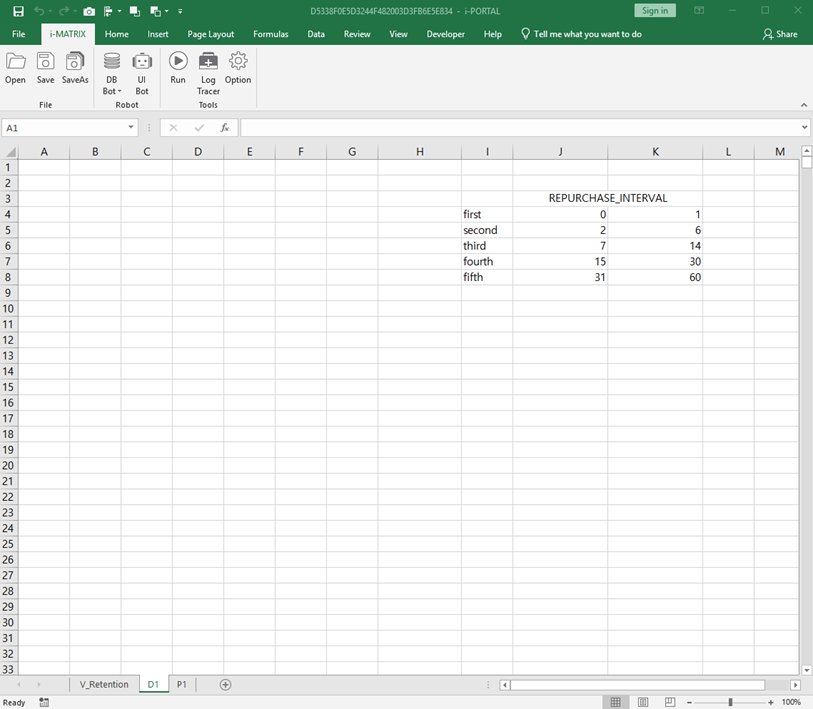
Sheet P : P1
Create variables to be used when querying data. You can define cell values as variables by using Excel’s ‘Name Manager’ feature.
In this exercise, we’ll use ‘Year’ ‘YearMonth’ as a variable to view the income statement by yearcustomer purchase status by month.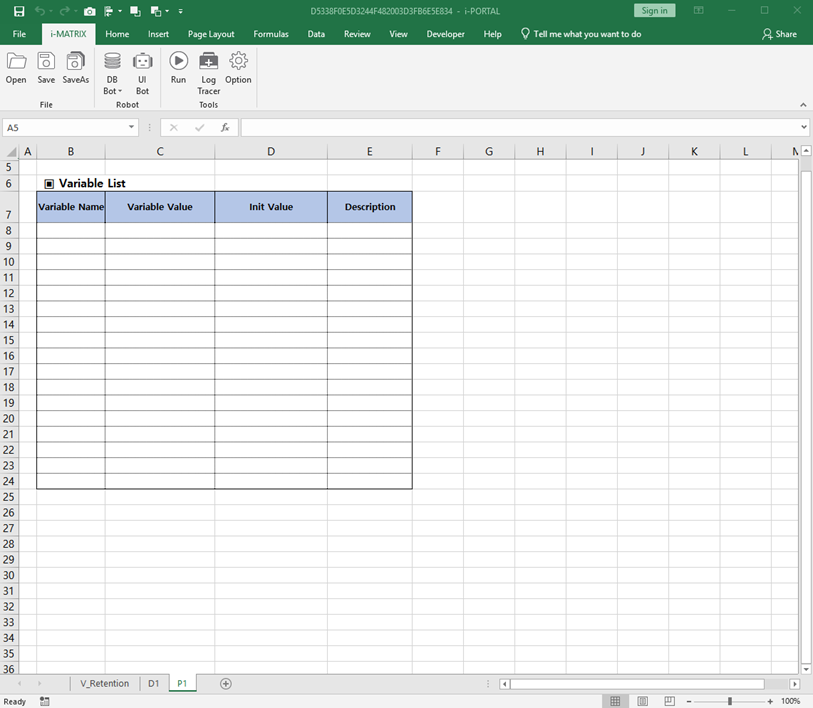
참고사항 title Excel Sheet Naming Convention The naming convention for Excel sheet is as follows:
...
- The database connection is complete.
- [Data Derivation Method] We will calculate the ‘Purchase Cycle’, necessary for V sheet, using the ‘Repurchase _ Interval’ values.
※ For more details on Data Derivation Method, refer to here. - Assign the ‘Purchase Cycle’ from ‘first’ to ‘fifth’ based on the ‘Repurchase _ Interval’, and enter the formula using Excel’s IF function.
=IF(D2="First-Time Purchase","-",IF(E2<=1,"first",IF(AND(E2>=2,E2<=6),"second",IF(AND(E2>=7,E2<=14),"third",IF(AND(E2>=15,E2<=30),"fourth","fifth"))))) - After entering the formula in row 2, click 'Run' from the i-MATRIX ribbon menu, and the formula will automatically fill down to cover the area with DB data.
Even if the number of records retrieved each month changes, the formula applied to the derived column will automatically be applied to all rows.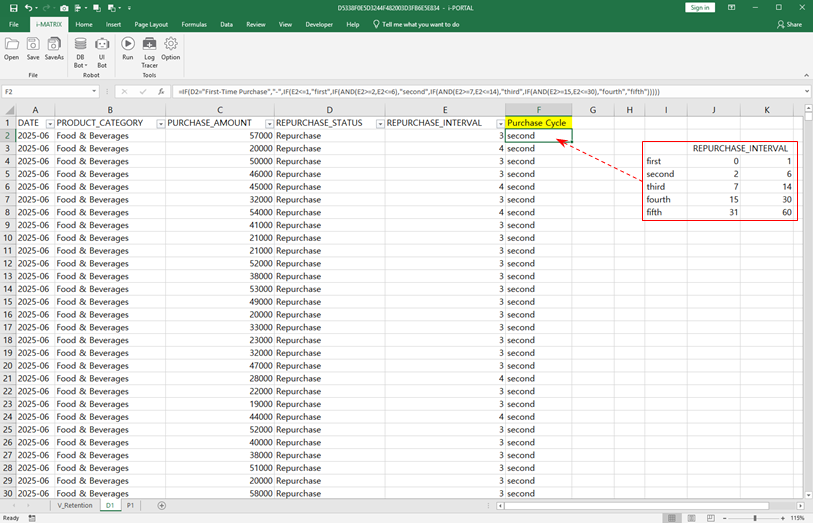
- The setup to connect data to the V sheet is complete.
...
- Next, add and configure the ‘YearMonth’ filter to view the Customer Retention Analysis report by month on the web.
- Place a ‘Period’ label and a calendar so that users can select the year and month to filter, and add a ‘Search’ ‘Refresh’ button to refresh data when clicked.
- From the UI Bot menu at the top, click Label and place it on the designer. In the Properties pane, change the Text propertyto ‘Period’, or press F2 on your keyboard. You can also customize the label’s font, color, and other style properties in Style.
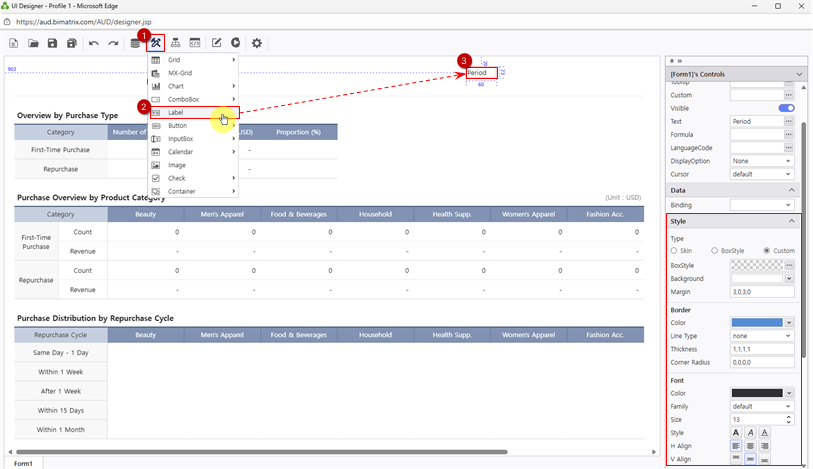
- Next, add the calendar.
- From UI Bot > Calendar, click Month and place it next to the label.
- Set the calendar’s Name property to VS_YM, the same variable you defined in the Excel’s ‘Name Manager’. This ensures that the value selected in the calendar is used as the filter condition.
* Optionally, set InitDate to define the default value when the report is first opened.
* Ensure that DataFormat matches both the DB data and the variable values defined in Excel. (yyyyMM → yyyy-MM)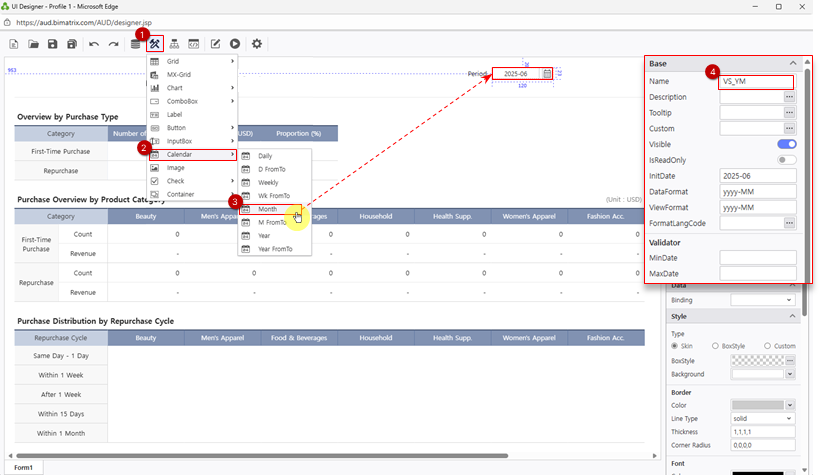
- Finally, add the ‘Search’ ‘Refresh’ button to the designer.
- From the UI Bot menu at the top, click Button and place it in the desired location on the designer.
- Similar to the ‘Period’ label, change the button’s Text property to ‘SearchRefresh’, and adjust its formatting in Style.
You can use BoxStyle to quickly apply a saved style to the button.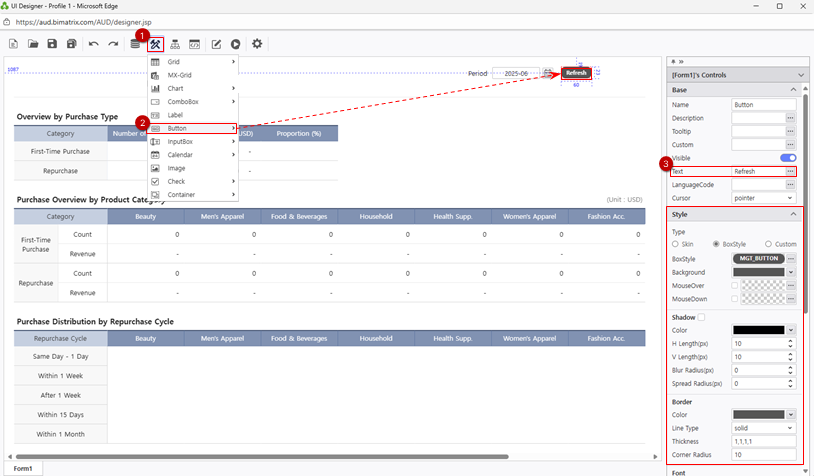
- Set up an event so that when the ‘Search’ ‘Refresh’ button is clicked, the report data is refreshed using the value from the YearMonth variable.
- Click Process Bot at the top. In the Objects panellist, double-click Button with a name ‘Search’‘Button’; in the Activities panellist, double-click 'Refresh'.
In the Refresh module details, select the MXGrid component to refresh, and drag a connection line from the Button to Refresh Module.
(Note: Dragging and dropping the Excel file onto the web screen automatically creates the MXGrid component.)
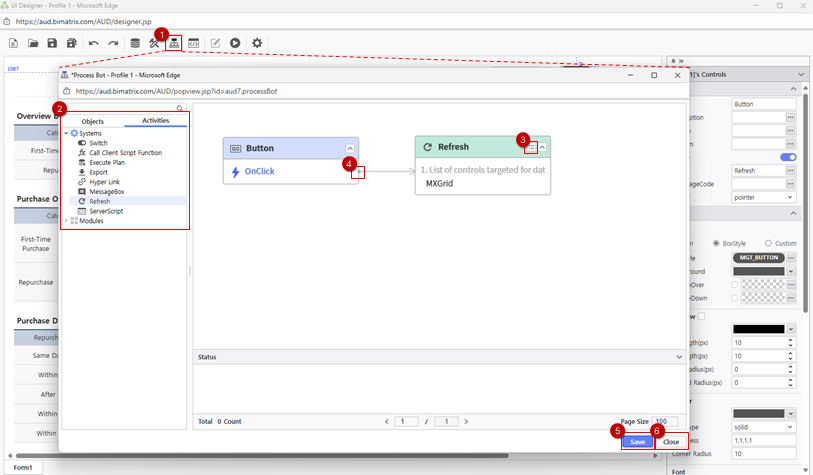
- Save and close the Process Bot.
- The report setup is now complete.
...